
In-depth explainer on crypto market cap: how it’s calculated, what circulating cap and FDV mean, the role in rankings, stablecoins, RWAs and indices, plus the metric’s limits and how traders, builders and institutions use it.
+11 sources across the wider coverage universe
 Predict.fun Adds Memecoin Prediction Markets for Fees, Listings and Market Cap Using Onchain Data2026-04
 ZachXBT calls out MemeCore over $6B market cap and heavy insider control, raising concerns after probing the collapse of its RAVE token ecosystem2026-04
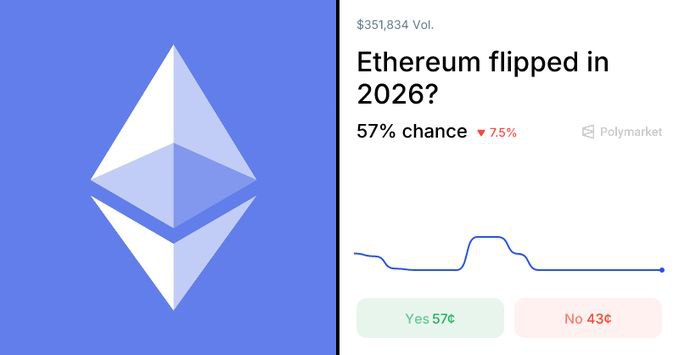 ALERT🚨: Ethereum now faces a 57% probability of losing its position as the second-largest cryptocurrency by market cap this year, signaling rising competition in the crypto market.2026-03
 CME targets June 8 for its first market-cap weighted Nasdaq CME crypto index futures across seven assets2026-05
 Crypto winter deepens in 2026 Q1 as total market cap drops 20% to 2.4T, BTC falls 22%, CEX volume sinks 39%, while stablecoins stay flat at 310B and oil surges 77% on war tensions.2026-04
 Ark Invest predicts Bitcoin could hit $16T market cap by 2030, driven by accelerating institutional demand and expanding role as a global digital reserve asset2026-05
Market Capitalization in Crypto: A Deep Guide to the Metric Behind the Rankings
In both traditional markets and digital assets, market capitalization is the headline number that claims to tell you how “big” an asset is, but in crypto that simple figure hides a great deal of nuance, especially once you factor in token unlocks, thin liquidity, stablecoins, real‑world assets and cross‑chain fragmentation. Used correctly, market cap helps contextualize risk, adoption and relative size across Bitcoin, Tether, Solana tokens and tokenized equities; used lazily, it can be gamed, misunderstood and even weaponized in narratives.
From Wall Street to Web3: What Market Cap Really Measures
Market capitalization originated in public equity markets as a straightforward measure of corporate size: the share price multiplied by the number of shares outstanding. In that setting, if a company has one billion shares outstanding and each trades at 10 dollars, its market capitalization is 10 billion dollars. The logic is that share price aggregates all available information about expected future cash flows, while the share count represents the slice of the company that public investors can own. The product is therefore interpreted as the equity market’s current valuation of the business, even though it is not the same as enterprise value or the cost to acquire the company outright. Over time this measure became a universal frame of reference, underpinning labels such as large‑cap, mid‑cap and small‑cap stocks and determining index weights in benchmarks like the S&P 500.
In equities, practitioners quickly realized that not all shares are equally available to trade, so they introduced variations such as free‑float market capitalization. Under free‑float methodologies, index providers exclude tightly held insider stakes, state holdings or other locked shares that are not part of the public float and compute market cap only from shares that can realistically trade. This adjustment reflects the reality that prices are set at the margin by free‑floating stock, not by the entire legal share count, and it prevents governance quirks or founder control from distorting index weights. Even in equity land, then, market cap is already partly a convention: a standardized way of translating two quantities—price and effective supply—into a comparative size metric.
When crypto markets emerged, they adopted this same basic idea and adapted it to tokens and coins. For a cryptocurrency such as Bitcoin, market capitalization is defined as the current price per coin multiplied by the number of coins in circulation. If there are 19.5 million bitcoins circulating and each trades around 60,000 dollars, the implied market cap is roughly 1.17 trillion dollars. Data aggregators such as CoinGecko and CoinMarketCap collect price and circulating supply data from exchanges and on‑chain sources, then compute this product as a standardized figure for ranking assets and comparing their relative size. On the surface, this continuity with traditional markets makes crypto more legible to institutions and regulators, but under the surface, the mechanics of supply, liquidity and token design make the metric more fragile and context‑dependent than it first appears.
What makes market cap especially salient in crypto is the sheer range of values it spans and the diversity of instruments it covers. At one end, Bitcoin has grown large enough that it frequently appears in rankings of the world’s largest assets by market capitalization, alongside mega‑cap technology companies and commodities such as gold and silver. At the other, a newly launched micro‑cap memecoin on Solana’s PumpFun may show a paper market cap of tens of millions of dollars within hours, based on a thinly traded float and a single automated market maker pool. Between those extremes sit dollar‑pegged stablecoins like Tether (USDT) and USDC, whose market caps function not as speculative valuations but as live measures of how many synthetic dollars circulate in crypto markets at any given time. Understanding what these different market cap numbers actually mean is the first step toward using the metric responsibly.

Predict.fun Adds Memecoin Prediction Markets for Fees, Listings and Market Cap Using Onchain Data
Promoting from Tsunami auto-feed. Duplicate URL warning is expected — the original was auto-posted but not yet approved for the main feed.
Readers click market cap stories not to understand valuation mechanics but to catch the gap between the headline number and the real one — circulating float vs. FDV, misleading meme launches vs. actual liquidity, and protocol revenue that dwarfs what the market cap implies.↗
How Market Capitalization is Calculated in Practice
The classical formula in traditional markets
In its simplest form, market capitalization is given by the formula \[ \text{Market Capitalization} = P \times N \] where \(P\) is the current market price per share and \(N\) is the number of shares outstanding. Shares outstanding include all issued shares held by public investors, company insiders and strategic partners, excluding only those explicitly retired or held as treasury stock. Stock exchanges publish real‑time prices; companies disclose their share counts in regulatory filings; and financial data providers combine these inputs to update market caps continuously.
Over time, a second layer of methodology evolved around this basic formula. Index providers introduced free‑float market capitalization, where \(N\) is adjusted down to include only shares available for public trading. Shares closely held by founders, governments or controlling shareholders are excluded or heavily discounted in the float calculation, on the grounds that they do not contribute to day‑to‑day price discovery. The resulting float‑adjusted market cap is what determines the weight of a stock in many benchmarks and exchange‑traded funds, because it better reflects the pool of capital that can actually move in and out of the name. In practice, this distinction between total and float‑adjusted capitalization is now so standard that many investors implicitly refer to the latter when they talk about a stock’s market cap.
The equity world thus teaches two important lessons that are directly relevant to crypto. First, even in a mature, regulated market, market cap is not a natural law but a metric built on methodological choices about what counts as supply. Second, those choices matter most at the margins, particularly for companies where large blocks are locked up, government‑owned or otherwise constrained from trading. In crypto, where vesting schedules, smart‑contract locks and multi‑chain bridges complicate the definition of “circulating,” the same issues appear in a new guise.
Crypto’s version: price times circulating supply
In crypto markets, the analog of shares outstanding is a token’s circulating supply, and the formula is written as \[ \text{Market Capitalization} = P \times S_{\text{circ}} \] where \(S_{\text{circ}}\) is the circulating supply of the asset. Circulating supply is typically defined as all coins or tokens that are not locked, burned or otherwise restricted from being traded on the open market. For Bitcoin, this is relatively straightforward: circulating supply is the number of coins mined minus any demonstrably burned or provably lost coins, and data providers use the protocol’s emission schedule and on‑chain data to approximate it. For smart‑contract tokens, it becomes more complex, as development funds, team allocations, vesting contracts and foundation treasuries must be evaluated to decide whether their holdings should be counted as circulating or excluded as locked.
Price, too, is non‑trivial in crypto because each asset trades on many venues, often across centralized exchanges, decentralized exchanges and derivatives platforms, with varying liquidity and spreads. Data aggregators such as CoinGecko ingest tick‑level prices and volumes from all exchanges that list an asset, then apply an algorithm to compute a volume‑weighted average price in a base currency such as USD. That aggregated price is multiplied by the circulating supply to obtain a single, standardized market cap figure that can be compared across chains and instruments. This approach mirrors the way equity indices use consolidated tape data from multiple stock exchanges, but crypto’s fragmented venues, spoofing risks and thinly traded pairs make the process more fragile.
A key methodological choice is that most crypto data sites use circulating supply, not total or maximum supply, when presenting market cap rankings. That means only tokens already in circulation count toward market cap; tokens that will be minted in the future or that are still locked in vesting contracts are ignored, even if they are guaranteed to exist under the protocol’s rules. This choice makes current market cap more comparable to float‑adjusted equity market cap but also opens the door to distortions when a project launches with a tiny circulating float relative to its eventual supply.
Stablecoins and pegged assets
Stablecoins introduce their own twist on market cap. For an asset like Tether (USDT), which targets a one‑to‑one peg with the U.S. dollar, market capitalization is still defined as price multiplied by circulating supply, but in practice price hovers very close to one dollar on liquid venues. That means the market cap of USDT is numerically almost equal to its circulating token count in dollars: if there are 160 billion USDT tokens in circulation and each trades around one dollar, USDT’s market cap is about 160 billion dollars. Data from major aggregators show Tether with a market cap of roughly 186 billion dollars, placing it among the largest crypto assets and making it a central pillar of dollar liquidity on exchanges.
USDC, a competing dollar‑backed stablecoin, follows the same logic. With a circulating supply of around 64 billion tokens and a price anchored near one dollar, its market cap is on the order of 75 billion dollars. Because the peg constrains price, changes in stablecoin market cap primarily reflect net issuance or redemption: new tokens minted when users deposit dollars with the issuer increase market cap; redemptions decrease it. In that sense, the market cap of a fully reserved, fiat‑backed stablecoin is not a speculative valuation but rather a live measure of the size of the issuer’s dollar liabilities and, under the assumption of full backing, the scale of its underlying reserves.
The stability of price does not mean stablecoin market caps are uninteresting. For traders and researchers, aggregate stablecoin market cap functions as a proxy for the total amount of “dry powder” denominated in dollars inside crypto markets, and shifts in the relative caps of USDT, USDC and newer entrants like RLUSD can signal changing preferences around regulatory risk, on‑chain functionality or counterparty trust. When coverage notes that RLUSD has reached a market cap of over 1.7 billion dollars less than a year after launch, that figure captures more than token speculation; it indicates meaningful adoption of a specific model of regulated, enterprise‑grade stablecoin for institutional use, with implications for liquidity on the networks where RLUSD circulates.
Beyond One Number: Variants of Market Cap in Crypto
Circulating market cap as the default benchmark
When traders talk about the “market cap” of Bitcoin, Solana or a DeFi governance token, they almost always mean circulating market capitalization: the product of the current price and the circulating supply. This is the metric used by major data aggregators to rank crypto assets by size and by many institutional players when they decide which coins to include in a mandate or index. In the CME Group’s Nasdaq CME Crypto Index futures, for example, the contract tracks a market‑cap‑weighted basket of leading cryptocurrencies, a design that requires standardized circulating market cap data across all constituents. That index, which includes assets like BTC, ETH, SOL and XRP, explicitly uses market cap weighting to align its exposures with the relative size of each asset’s tradable float in the broader market.
Because it is so widely used, circulating market cap underpins labels like “large‑cap crypto,” “mid‑cap altcoins” and “micro‑cap memecoins.” Frameworks that categorize Bitcoin and major layer‑1s as large‑cap, DeFi blue chips as mid‑cap and newly launched tokens on Solana or Ethereum as small‑cap rely on this metric to structure conversations about risk, liquidity and expected volatility. A project that climbs from a 100 million to a 10 billion dollar circulating market cap graduates into a different risk bucket, attracting a new class of investors and, in some cases, becoming eligible for inclusion in market‑cap‑weighted index products or derivatives.
Yet even this seemingly simple metric embeds assumptions that can differ by data provider. What counts as circulating supply for a token with complex vesting schedules and multi‑sig treasury wallets is partly a methodological judgment. Some aggregators may count foundation holdings as non‑circulating if they are time‑locked or controlled by governance, while others may treat them as circulating due to their potential to be sold. For practitioners comparing market caps across assets, it is often worth checking the methodology pages of data providers to understand how they classify supply in ambiguous cases.
Fully Diluted Valuation (FDV)
A second key metric that crypto borrowed from venture capital is fully diluted valuation (FDV). FDV attempts to answer a different question: not what the token is worth given current float, but what it would be worth if all tokens that can ever exist were already in circulation at today’s price. Formally, it can be expressed as \[ \text{FDV} = P \times S_{\text{max}} \] where \(S_{\text{max}}\) is the maximum possible supply under the token’s design, whether that is a hard cap like Bitcoin’s 21 million or an asymptotic supply for an inflationary token. Educational resources describe FDV as a forward‑looking projection of market cap that assumes the entire supply is live, even if most of it is still locked, vested or not yet minted.
Crypto analytics platforms and exchanges often display both circulating market cap and FDV for a given asset, and the gap between the two can be instructive. If a token has a circulating market cap of 1 billion dollars but an FDV of 20 billion dollars, that implies only 5 percent of its eventual supply is currently trading. The remaining 95 percent, once unlocked or minted, could exert significant sell pressure at current prices, making the token’s valuation vulnerable to dilution. Conversely, a token whose circulating market cap is already close to its FDV may have limited additional supply overhang, though other risks remain.
FDV is especially important in the context of “low float, high FDV” launches, where a project lists a small fraction of its token supply on a launchpad or decentralized exchange, establishes a high price on thin volume and thereby creates a large FDV headline number. While the circulating market cap may still be modest, the FDV figure can be used in narratives about the project’s implied “valuation,” inviting comparisons with established networks or even large public companies. For traders, this is a warning sign: a high FDV relative to circulating cap often signals significant future emissions, team unlocks or investor cliffs that may pressure price unless organic demand grows proportionally.
Free‑float and float‑adjusted concepts in tokens
The equity notion of free float has begun to migrate into crypto discourse, though it remains less standardized. In principle, one could define a float‑adjusted token market cap as \[ \text{Float‑Adjusted Market Cap} = P \times S_{\text{float}} \] where \(S_{\text{float}}\) counts only tokens that are both unlocked and held by actors likely to trade them in the open market, excluding, for example, governance‑controlled treasury reserves, foundation endowments with long‑term mandates and tokens burned or provably lost. Some analytics teams and research shops internally track such free‑float measures when assessing how much of a token’s supply is actively circulating versus concentrated in long‑term or restricted holdings.
Although major public data aggregators mostly stick to their own definitions of circulating supply, the spirit of free‑float methodology is highly relevant to crypto risk analysis. For example, a chain might show a large number of tokens technically unlocked and therefore counted as circulating, but if a dominant share is held in multisig wallets controlled by a small group of early backers, the effective float is smaller than the headline number suggests. Traders and on‑chain analysts often supplement market cap figures with wallet distribution analyses, token unlock schedules and treasury disclosure to build a more nuanced picture of float.
Category and chain‑level market caps
Beyond individual tokens, practitioners and journalists increasingly talk about market cap at the level of categories and chains. A sector’s total market cap can be computed as the sum of market caps of all assets classified into that category, such as all DeFi tokens, all stablecoins or all tokenized real‑world assets (RWAs). When coverage notes that tokenized equities have reached a combined market cap in the billions of dollars, or that tokenized stocks as a category added hundreds of millions in market cap over a quarter, those figures represent such aggregated sums, used to track sectoral adoption over time.
Similarly, chain‑level analyses often aggregate the market caps of all assets issued on or closely associated with a particular blockchain. Reports that, for example, Solana’s RWA market cap has climbed to around 2 billion dollars, or that the chain’s “GDP” measured via protocol revenues reached hundreds of millions, are part of a broader trend to treat market cap as one component of an economic profile for a network. On Ethereum, narratives about the chain’s dominance in tokenized treasuries and RWAs often cite its share of global on‑chain RWA market cap, with figures suggesting well over half of such assets by value reside on Ethereum and its rollups. In stablecoins, chain‑specific market cap data show the distribution of USDT, USDC and other dollar‑pegged tokens across networks, with Solana, Ethereum and newer high‑throughput chains competing for stablecoin float as a key indicator of ecosystem health.
These aggregated market cap statistics are conceptually straightforward—the sum of individual caps—but analytically rich. They help investors compare not only tokens but entire narratives: Ethereum as the default settlement layer for RWAs, Solana as a high‑throughput venue for consumer apps whose tokenized GDP is growing, or Bitcoin as digital collateral whose market cap relative to gold or major tech stocks provides a measure of its macro footprint. They also highlight how market cap is becoming a language for describing not just assets but whole economic systems built on crypto rails.
- 01Memecoin float vs. FDV distortion↗
The TRUMP memecoin's $75B headline figure versus a float-adjusted $13B made readers viscerally aware that reported market cap is a choice, not a fact, and that the choice can mislead by 6×.
- 02Stablecoin market cap as macro signal↗
Readers tracked stablecoin aggregate market cap — $140B 2022 peak, 18 months of consecutive decline, then a surge past $300B — as a real-time risk-appetite gauge for the entire crypto market.
- 03AI agent sector cap volatility↗
A sector swinging from a 700% surge to $31B down to $4.38B in weeks showed readers how thin liquidity turns market cap into a noise signal rather than a value signal.
- 04Protocol revenue vs. market cap efficiency↗
Hyperliquid generating $9.5M in 24h revenue at 18–60× lower market cap than SOL/ETH attracted readers hunting for undervaluation signals based on earnings yield rather than supply math.
- 05Bitcoin dominance milestones↗
BTC overtaking ETH by $1T and briefly ranking among the top global assets by market cap turned an abstract metric into a geopolitical and institutional legitimacy scorecard.
- 06RWA and institutional market cap projections↗
Binance's $16T RWA estimate for 2030 gave readers a scale anchor — showing that even the entire 2024 crypto market cap would be a rounding error in tokenized real-world assets.
Using Market Cap to Compare Cryptocurrencies
Large‑caps, mid‑caps and long‑tail tokens
In practice, most crypto investors encounter market cap through rankings that order assets from largest to smallest by circulating capitalization. These rankings, popularized by platforms like CoinGecko and CoinMarketCap, present Bitcoin and Ethereum at the top, followed by major stablecoins such as Tether and USDC and leading layer‑1s and DeFi tokens. From this ordering emerge informal tiers: large‑cap assets at the top, mid‑caps in the middle, and small‑ or micro‑caps in the long tail.
Large‑cap crypto assets, often defined loosely as those with market caps in the tens or hundreds of billions of dollars, tend to exhibit deeper liquidity, tighter spreads and more institutional participation. Bitcoin, for instance, has grown to a market cap large enough to rank among the top global assets, though it occasionally drops in and out of the top ten when price retraces relative to mega‑cap equities and commodities. Such shifts are covered not just in crypto news but in broader financial press, highlighting how market cap has become the lingua franca for comparing BTC with companies like Saudi Aramco, TSMC or Meta Platforms. The fact that Bitcoin can move from eighth to eleventh place in global asset rankings as its market cap dips from around 1.6 trillion to closer to one trillion dollars offers a vivid illustration of the volatility embedded in digital asset valuations.
Mid‑cap assets, including many layer‑1 tokens, DeFi governance tokens and infrastructure plays, occupy a middle ground. They are large enough to have significant on‑chain ecosystems, derivatives markets and institutional interest, yet still small enough that new information, tokenomics changes or regulatory developments can move prices sharply, driving significant shifts in market cap. The rapid ascent of certain exchange tokens or perpetuals platforms to become top‑ten or top‑twenty assets by market cap, as highlighted in research on platforms like Hyperliquid, demonstrates how quickly a mid‑cap narrative can crystallize into a large‑cap reality when revenue growth and token demand align.
At the small‑cap and micro‑cap end, market cap becomes more fragile as a metric. Newly launched tokens on Solana or other high‑throughput chains may show impressive headline market caps based on thin order books, a small circulating float and prices discovered in a single decentralized exchange pool. Without deep liquidity or a broad holder base, these numbers can be more aspirational than reflective of real capital committed, and they are more vulnerable to market manipulation, wash trading or orchestrated pumps. Investors comparing assets by market cap must therefore adjust their confidence in the metric based on liquidity and volume, not treat it as equally reliable across every tier.
Index construction and market‑cap weighting
Market capitalization is not only a classification tool but also a mechanical input into index construction. In traditional finance, most major equity indices are market‑cap weighted, meaning each stock’s weight in the index is proportional to its float‑adjusted market cap. Crypto is increasingly following suit. The Nasdaq CME Crypto Index futures launched by CME Group, for instance, track a market‑cap‑weighted basket of leading cryptocurrencies, providing a standardized way for institutional investors to gain diversified exposure to the top of the crypto market. The fact that this contract is described as CME’s first market‑cap‑weighted crypto futures underscores how central the metric has become for translating a sprawling, heterogeneous set of tokens into investable indices.
Market‑cap weighting offers several advantages. It automatically tilts toward larger, more liquid assets, which are easier to trade in size and less prone to idiosyncratic collapses. It aligns index weights with the aggregate holdings of the market, in the sense that if an asset’s market cap doubles relative to others, its share in the index naturally rises. But it also inherits the biases of market cap itself, overweighting assets that may be overvalued or benefiting from speculative bubbles, and underweighting those that are undervalued or still early in their growth trajectory. For crypto, where cycles of narrative‑driven capital flows are pronounced, this means that a market‑cap‑weighted index may exacerbate pro‑cyclical behavior, channeling more capital into already expensive large‑caps at the expense of emerging projects.
Some index providers and structured product issuers respond by using alternative weighting schemes—such as equal weighting, square‑root market‑cap weighting or capped weights—to mitigate concentration risk. Others apply filters based not only on market cap but also on liquidity and trading volume, excluding assets that do not meet thresholds for daily turnover or exchange coverage. Regardless of these nuances, market cap remains the starting point, the reference against which other weighting schemes define themselves.
Cross‑asset comparisons: Bitcoin vs tech stocks, stablecoins vs banks
One of the most visible uses of market cap is in cross‑asset comparisons that place crypto alongside traditional equities, commodities and currencies. Sites that rank “assets by market cap” list everything from Apple and Microsoft to gold, silver, Bitcoin and even ETFs, giving investors a single table where they can see, for example, that Bitcoin now sits within striking distance of a top‑ten global asset but still trails the combined market cap of major technology firms. Stories noting that Bitcoin has temporarily fallen out of the top ten, sliding behind Saudi Aramco or major semiconductor firms as its market cap retreats, are essentially narratives about BTC’s place in the global capital structure.
These comparisons are powerful but can be conceptually slippery. A company’s equity market cap represents the market’s valuation of its future cash flows; gold’s market cap represents the value of all above‑ground stock at current prices; Bitcoin’s represents the value the market assigns to its fixed supply of coins as a store of value, speculative asset or collateral. The fact that all three can be expressed in dollars and ranked does not mean they measure the same underlying quantities. For that reason, cross‑asset market cap comparisons are most useful as a way to understand relative scale—the rough order of magnitude of capital allocated to different narratives—rather than as precise valuation metrics.
Stablecoins invite another set of cross‑asset analogies. Because their market caps are numerically close to their outstanding liabilities, observers sometimes compare the total market cap of dollar‑backed stablecoins to the deposit base of mid‑size banks or the assets under management of money‑market funds. When Tether’s market cap climbs into the high tens or low hundreds of billions of dollars, it enters the same ballpark as certain large financial institutions, raising questions about systemic importance and regulatory oversight. Similarly, the combined market cap of all stablecoins—whether concentrated in USDT and USDC or spread across newer entrants—serves as a gauge of how much tokenized dollar liquidity exists on public blockchains, which in turn underpins spot trading, derivatives margining, DeFi lending and on‑chain payments.

ZachXBT calls out MemeCore over $6B market cap and heavy insider control, raising concerns after probing the collapse of its RAVE token ecosystem
$6B cap against $66M in app volume is a 91x disconnect that only pencils out if Kraken and Binance books are doing all the price discovery while the chain sits empty. Wallet 0x8b8 at $178M and a Binance deposit address as the largest visible holder maps directly onto RAVE's template — three wallets on 90% of float, 24% circulating, then down 95% in a week. FDV at $18.1B means every unlock cliff is a reflexive sell into whatever thin native liquidity remains after the CEX bid disappears.
Market Cap, Liquidity and Trading Volume
Why liquidity matters for interpreting market cap
Although market cap is computed from price and supply, liquidity and trading volume crucially influence how informative that price is. Liquidity, in financial economics, is commonly defined as the ability to buy or sell an asset quickly, in size, without causing a large move in its price. Liquid markets exhibit narrow bid–ask spreads, deep order books and substantial trading volume; illiquid markets are characterized by thin books, wide spreads and larger price impact for a given trade. In the context of crypto, where many tokens are listed on only a handful of exchanges or decentralized pools, liquidity conditions can vary widely across assets with similar headline market caps.
Empirical research on cryptocurrency markets has shown that the relationship between trading volume, liquidity provision and returns can be quite different for high‑volume versus low‑volume pairs. One study examining liquidity provision strategies found that short‑term reversal returns—a proxy for the compensation liquidity providers earn—are concentrated in pairs with lower trading activity, while in high‑volume pairs such reversal strategies generate returns close to zero and are statistically insignificant. This suggests that illiquid, low‑volume tokens require a higher return to compensate liquidity providers for adverse selection and inventory risk, whereas large‑cap, high‑volume assets are more competitively priced and less prone to such anomalies. From a market cap perspective, it underscores that a high capitalization figure does not guarantee liquidity; one must always examine volume and market microstructure alongside market cap.
Data platforms like CoinGecko explicitly separate market cap metrics from trading volume metrics and publish both for each asset. Market cap is computed from price and circulating supply, while 24‑hour trading volume is calculated as the sum of traded value across all monitored pairs on centralized and decentralized exchanges. For Tether, for example, reported daily trading volumes can approach or even exceed half its market cap, reflecting its role as a dominant settlement asset across multiple exchanges. For USDC, daily volumes are typically smaller relative to its market cap, reflecting a mix of trading use and long‑term holding in DeFi positions or corporate treasuries. By comparing volume to market cap, investors can gauge how “turnover‑heavy” an asset is and how quickly positions can be entered or exited without undue slippage.
How manipulation and thin books can distort market cap
Market cap assumes that the current quoted price is representative of the marginal value assigned by the market to the entire circulating supply. In illiquid markets, this assumption can break down. If only a tiny fraction of the float trades each day, and order books are thin, it may be possible for a small group of actors to push the price up or down dramatically through coordinated buying or selling, thereby inflating or deflating the market cap on paper without a corresponding change in fundamental demand. Crypto’s history is replete with cases where micro‑cap tokens briefly reached eye‑catching market caps due to such thin‑book price spikes, only to crash once the initial buying pressure faded.
Educational materials on crypto market cap explicitly warn about this vulnerability. Gemini, for instance, notes that the market capitalization of illiquid coins can be artificially increased through manipulation because small trades can move price significantly when order books are shallow. Data aggregators attempt to mitigate this by excluding obviously suspicious exchange data, applying minimum volume thresholds and sometimes flagging assets whose reported volumes or prices appear unreliable. Nevertheless, in the long tail of altcoins and memecoins, market cap figures remain more fragile and should be treated as rough indicators rather than solid measures of invested capital.
This is particularly relevant for new token launches on high‑throughput chains like Solana, where launchpad platforms allow teams to list tokens with minimal initial liquidity and quickly bootstrap price discovery. Tools such as Aethir’s CARA, a crypto‑native AI agent that can scan launchpad listings for live market cap, trading volume and liquidity data, are helpful precisely because they let users see these metrics side by side, rather than focusing on market cap alone. A token might show a multi‑million dollar market cap a few hours after launch, but if its 24‑hour volume is low and liquidity in its primary pool is thin, that market cap is best interpreted as a fragile snapshot, not a durable valuation anchor.
Liquidity, size and expected returns
From a portfolio construction perspective, the relationship between market cap, liquidity and expected returns is subtle. Academic research suggests that in cryptocurrency markets, as in equities, smaller, less liquid assets can offer higher expected returns, in part because they carry greater liquidity risk and information asymmetry. The same study that documented concentration of short‑term reversal returns in low‑volume pairs found that larger, more liquid and less volatile assets exhibited reversal strategy returns that were near zero and statistically insignificant. This pattern is consistent with the idea that liquidity provision in small, illiquid tokens is riskier and therefore must be compensated with higher expected returns, while large‑cap tokens like Bitcoin or major stablecoins are more efficiently priced and offer fewer easy arbitrage opportunities.
For traders and allocators, this implies that chasing small‑cap tokens solely based on their potential upside, as suggested by low absolute market caps, must be balanced against the risk of being trapped in illiquid positions or suffering large price impact when exiting. Conversely, large‑cap tokens with deep liquidity and high market caps may offer lower idiosyncratic return potential but function as more reliable building blocks for structured products, indices and collateral frameworks. Understanding where an asset sits on the spectrum of market cap and liquidity is therefore essential for sizing positions, setting risk limits and designing trading strategies.
Stablecoin market cap hits $140B all-time high
Stablecoin market cap enters 18-month consecutive decline
Ethena USDe crosses $2B supply within two months of launch
Bitcoin market cap surpasses Ethereum by $1 trillion at $68,420
TRUMP memecoin reports $75B market cap; float-adjusted figure ~$13B
AI agent sector market cap peaks near $31B then enters prolonged decline
Total stablecoin market cap surpasses $300B for the first time
CME Group announces Nasdaq CME Crypto Index futures, adding institutional market-cap benchmarking layer
Stablecoin Market Caps: Dollars on Chain
Tether, USDC and the role of stablecoin float
Among all crypto assets, stablecoins provide perhaps the clearest illustration of how market cap can serve as a proxy for economic function. Tether (USDT), the largest dollar‑pegged stablecoin, has a market cap in the mid‑hundreds of billions of dollars range, placing it among the very largest crypto assets by capitalization. With a circulating supply around 160 billion tokens and a price that remains close to one dollar, its market cap simply reflects the total value of dollar claims represented by all outstanding Tether tokens. Daily trading volumes often reach tens of billions of dollars, underscoring USDT’s role as the primary trading pair and settlement asset on many centralized and decentralized exchanges.
USDC, issued by a consortium built around a major U.S. fintech, has a smaller but still significant market cap, on the order of 70 to 80 billion dollars, supported by a circulating supply of roughly 64 billion tokens and a price closely anchored to one dollar. Its daily trading volumes are lower than Tether’s but still in the multibillion dollar range, and a meaningful portion of USDC is held in DeFi protocols as collateral or liquidity, rather than transacting frequently on exchanges. The ratio of trading volume to market cap is therefore lower for USDC than for USDT, suggesting different usage patterns: Tether as a high‑velocity trading chip; USDC as a somewhat more “sticky” stablecoin embedded in protocols and institutional flows.
The aggregate market cap of dollar stablecoins, when summed across USDT, USDC and other competitors, has grown into the hundreds of billions of dollars, reflecting the migration of dollar‑like balances from traditional bank accounts and money‑market funds onto public blockchains. Sector reports noting that stablecoin market cap grew by over 90 percent year‑over‑year to new all‑time highs capture not only speculative cycles but also the increasing institutionalization of stablecoin usage, as corporates, fintechs and even financial institutions integrate tokens into payment flows, treasury management and on‑chain capital markets. In that sense, stablecoin market cap is both a capital markets metric and a macro indicator of crypto’s penetration into mainstream financial plumbing.
New entrants and regionalization: RLUSD and others
While USDT and USDC dominate the stablecoin landscape, new entrants increasingly carve out niches based on regulatory posture, jurisdiction and integration with specific ecosystems. RLUSD, for instance, positions itself as a regulated, enterprise‑grade stablecoin and has grown from launch to a market cap of over 1.7 billion dollars in under a year, according to recent coverage. That pace of growth, while modest compared with Tether’s scale, illustrates how market cap can serve as a scoreboard for stablecoin experiments tailored to particular jurisdictions or institutional client bases. When Ripple announces that RLUSD is now available through Turkish partners and highlights its market cap milestones, it is using the same metric—increased float—as evidence of traction in cross‑border payments and on‑chain treasury use.
Regionalization of stablecoin market caps also plays out at the chain level. Some networks position themselves as hubs for specific types of stablecoin activity—for example, Solana as a high‑throughput settlement layer for payments and retail DeFi, or Ethereum as a base layer for institutional tokenized cash. Chain‑specific market cap data show how much of USDT, USDC and other stablecoins reside on each network, providing a window into where demand for tokenized dollars is strongest. In this way, a stablecoin’s aggregate market cap, together with its chain‑level distribution, informs views on ecosystem health and strategic positioning in the broader markets landscape.
Stablecoin caps as indicators of trust and regulation
Unlike volatile tokens, where market cap changes reflect both price movements and shifts in supply, changes in stablecoin market caps largely track issuance and redemption, since price is anchored. An increase in Tether’s market cap implies that more users are willing to hold USDT claims on Tether’s reserves, indicating either rising demand for on‑chain dollars or a shift in preference from competing stablecoins. Conversely, a decline in USDC’s market cap might signal redemptions driven by yield differentials, concerns about underlying reserves or changes in regulatory posture affecting certain user segments.
Stablecoin market caps thus embody a delicate interplay between market demand, regulatory developments and transparency around reserve management. A large cap does not automatically guarantee safety, but it does signal that many users have entrusted capital to the issuer’s structure. For regulators and policymakers, the rapid growth of stablecoin market caps raises questions about systemic risk and the appropriate oversight framework, particularly when individual issuers approach sizes comparable to significant banks or money‑market funds. For crypto market participants, monitoring shifts in stablecoin market share is essential for understanding liquidity conditions, funding markets and the relative importance of different rails in on‑chain finance.
Emerging Sectors: RWAs, Tokenized Equities and Crypto‑Native Platforms
Real‑world assets and tokenized securities
The rise of tokenized real‑world assets, or RWAs, has introduced new categories of market cap into the crypto lexicon. Tokenized U.S. Treasury bills, money‑market funds, commercial real estate and corporate bonds now trade on public blockchains in the form of ERC‑20 or similar tokens, each with its own circulating supply and price. Aggregating the market caps of these instruments provides a measure of the total value of real‑world financial claims represented on‑chain. Reports pointing to RWA market caps in the tens of billions of dollars, with Ethereum controlling a majority share of these on‑chain assets, highlight how tokenization is gradually shifting a slice of traditional capital markets into programmable forms.
Tokenized equities are a particularly vivid example. Coverage noting that tokenized equities have reached a market cap of around 5.5 billion dollars, helped by access to high‑profile names like SpaceX and by expansion across exchanges, shows how equity exposure can be represented and traded on crypto rails even before or alongside traditional IPOs. Likewise, tokenized stocks—a broader category that includes wrapped versions of publicly traded shares—have been reported at market caps exceeding 1.5 billion dollars, with rapid growth over short periods as infrastructure improves and regulatory clarity evolves. In both cases, market cap is used to track not just token prices but the scale of a new mode of capital markets access.
This tokenization trend interacts with traditional market cap narratives in interesting ways. When social media commentary suggests that a token representing pre‑IPO SpaceX exposure could open at a market cap of 1.75 trillion dollars, vastly exceeding the likely equity valuation, it underscores how speculative markets can temporarily detach from fundamentals when dealing with synthetic or derivative claims. Such predictions often conflate token market cap, implied equity value and broader narrative hype. For serious investors, disentangling these threads requires understanding exactly what the token represents, how its supply is structured and whether its market cap is truly comparable to that of the underlying equity.
Chain‑level economies: Solana’s GDP and RWA footprint
Some analysts go beyond token‑level market caps to describe entire chain economies using metrics like “chain GDP,” aggregating protocol revenues, transaction fees and tokenized asset values. In the case of Solana, reports of quarterly chain GDP reaching around 342 million dollars, with a significant contribution from applications like PumpFun, come alongside figures for Solana’s on‑chain RWA market cap, which has climbed beyond 2 billion dollars. These numbers highlight how a high‑throughput, low‑fee chain can host both speculative memecoins and regulated tokenized treasuries, with market cap serving as a unifying measure of value represented on the network.
Within such ecosystems, market cap also informs internal capital allocation. DeFi protocols on Solana or Ethereum may prioritize listing and integrating assets whose market caps and volumes are large enough to attract users while still offering upside. Builders track the market caps of RWAs, stablecoins and governance tokens on their chains to assess addressable markets and the potential impact of new products. When a network’s RWA market cap grows faster than its native token’s, it may indicate that the chain is evolving toward a role as neutral settlement infrastructure rather than a purely speculative asset, altering how investors perceive and value its native token’s market cap.
Crypto‑native platforms and protocol tokens
Beyond RWAs and stablecoins, crypto‑native platforms themselves are increasingly analyzed through the lens of market cap. Perpetuals exchanges, restaking protocols, modular data availability layers and AI compute networks often issue governance or utility tokens whose market caps reflect a blend of fee‑sharing rights, control over protocol parameters and speculative expectations about future growth. Grayscale’s research positioning Hyperliquid’s token as a breakout success, with revenues approaching hundreds of millions of dollars and a market cap large enough to rank among the top ten crypto assets, illustrates how quickly protocol tokens can ascend when they capture significant user activity.
Similarly, reports of HYPE, a privacy‑focused token, surpassing Dogecoin’s market cap during risk‑on periods show how market cap rankings are fluid, reshuffled as new narratives gain traction and older memes fade. When spot HYPE ETFs absorb over one percent of the token’s market cap in their first ten trading days, that statistic highlights the intersection of token market caps with ETF flows and secondary demand, echoing earlier episodes when spot Bitcoin ETFs began absorbing a significant share of BTC’s float. In all these cases, market cap is the denominator against which flows, ETF holdings and on‑chain positions are measured.
ALERT🚨: Ethereum now faces a 57% probability of losing its position as the second-largest cryptocurrency by market cap this year, signaling rising competition in the crypto market.
There is something called royalty when comparing crypto coins. ETH will always be
Locked team/insider supply can make reported circulating market cap a fraction of true diluted exposure; TRUMP launched with ~17% float, inflating the headline figure by roughly 6× versus a float-adjusted valuation.
Fully diluted valuation can exceed circulating market cap by orders of magnitude — JUP launched at a $700M circulating cap while total supply implied a far larger FDV — creating hidden sell pressure as vesting unlocks.
AI agent tokens swung 700% up and 77.5% down within weeks at a $31B peak cap, demonstrating that thin order books allow market cap to move violently on small actual capital flows.
CoinGecko and CoinMarketCap each apply distinct methodologies for circulating supply, causing the same asset to show materially different market caps across aggregators.
Reporting total-supply market cap as a headline figure for assets with restricted floats has drawn analyst and media criticism and may increasingly attract securities-disclosure scrutiny.
Stablecoin market cap is a more reliable metric than speculative tokens because supply is redeemable 1:1, though issuer reserve transparency (USDT vs. USDC attestation standards) still introduces verification risk.
Limits and Misuses of Market Cap
The illusion of cheapness and the unit bias
One common misuse of market cap arises when investors focus on token price per unit rather than market cap, leading to the so‑called unit bias. A coin trading at 0.01 dollars may appear “cheap” relative to Bitcoin at tens of thousands of dollars, even if the cheap‑looking coin has a larger total supply and thus a comparable or larger market cap. Market cap, not unit price, is the relevant metric for comparing how much value the market has assigned to one asset versus another. However, if market cap itself is not examined closely—particularly with respect to supply structure and liquidity—investors can fall into new traps.
The illusion of cheapness often overlaps with FDV concerns. A token may have a circulating market cap of only a few million dollars, suggesting it is “early,” but if its FDV is in the tens of billions based on a huge maximum supply, the implied valuation is already rich relative to fundamentals, and future unlocks could exert significant downward pressure. Without examining both current market cap and FDV, and without understanding the vesting schedule, investors may misinterpret the token’s apparent upside. Educational resources emphasize that token price alone “won’t cut it”; to understand how much a cryptocurrency is really worth, one must consider both circulating market cap and FDV to get a fuller picture of valuation and dilution risk.
Market manipulation and thin liquidity
As discussed earlier, the market caps of illiquid tokens are particularly susceptible to manipulation. Gemini explicitly warns that the market cap of coins with low liquidity can be artificially boosted because small trades can move prices sharply, inflating the product of price and circulating supply. In extreme cases, a team or coordinated group might list a token with a large declared supply, provide minimal liquidity, then execute wash trades to push the price higher, creating a paper market cap in the tens or hundreds of millions of dollars with only a few thousand dollars of real capital at risk. Unsuspecting observers who sort by market cap alone may then see the token alongside genuine mid‑caps, lending it an air of legitimacy it does not deserve.
Data providers attempt to filter out obvious wash trading and suspicious exchanges, but they cannot fully eliminate manipulation, especially on decentralized exchanges where on‑chain activity may mask coordinated behavior. For that reason, serious analysts always contextualize market cap with metrics such as trading volume, number of holders, liquidity depth on major pairs and time‑series stability of price. A token whose market cap spikes and collapses within days, with inconsistent volume and concentrated holder distribution, warrants caution even if its headline valuations briefly look impressive.
Stablecoin caps and hidden risks
Stablecoin market caps, while more mechanically tied to outstanding liabilities, can also be misinterpreted. A large market cap may suggest robustness and deep market penetration, but it does not reveal the quality or liquidity of underlying reserves, the legal structure of the issuer or the risk of regulatory intervention. Tether’s massive market cap indicates that users are willing to hold USDT balances at scale, but debates continue about the composition and transparency of its reserves, even if the issuer publishes attestations and breakdowns. Similarly, a smaller stablecoin with a fraction of the market cap may have a more conservative reserve structure or a more regulated framework, yet lack the network effects and exchange integrations of the dominant players.
Moreover, because stablecoin prices remain near one dollar, changes in their market caps may be interpreted too literally as net inflows or outflows of dollars into crypto. In practice, some issuance and redemption flows simply reflect users switching between stablecoins or between centralized and decentralized representations of dollar claims. A new stablecoin like RLUSD can grow its market cap quickly by capturing share from existing tokens rather than bringing entirely new capital into the space. Analysts must therefore read stablecoin market cap data in the context of broader capital flows, real‑world yields and regulatory changes.
Cross‑asset comparisons and narrative overreach
Finally, cross‑asset market cap comparisons can be rhetorically powerful but analytically shaky. Statements such as “token X is now worth more than company Y” or “Bitcoin’s market cap is larger than that of bank Z” can capture attention but obscure profound differences in what those market caps represent. Company equity represents discounted expectations of future cash flows; a governance token’s market cap may represent expectations of protocol fee sharing, governance rights or simply speculative fervor; gold’s market cap reflects the value of a non‑yielding store of value; stablecoins’ caps represent outstanding liabilities backed by reserves.
Comparisons are most useful when they are clearly framed as scale analogies rather than valuation judgments. Highlighting that Bitcoin’s market cap is now a meaningful fraction of gold’s, or that stablecoins collectively rival the deposit base of mid‑size banks, helps readers appreciate crypto’s macro footprint. But using such comparisons to argue that a token is “undervalued” or “overdue” for re‑rating relative to unrelated assets risks conflating narrative with analysis. A disciplined approach to market cap treats it as a starting point for inquiry, not a conclusion.
How Market Participants Actually Use Market Cap
Traders and portfolio managers
For active traders and portfolio managers, market cap is a basic screening and sizing tool. When constructing a portfolio of crypto assets, many start by defining an investable universe based on minimum market cap and liquidity thresholds, excluding micro‑caps that cannot absorb institutional‑scale orders without excessive price impact. Among the remaining assets, market cap informs position sizing and diversification: a manager may cap exposure to any single large‑cap at a given percentage of portfolio value, while smaller allocations to higher‑risk mid‑caps or small‑caps are sized proportionally to their volatility and liquidity.
Within this framework, traders use market cap in combination with other metrics—such as realized volatility, Sharpe ratios, on‑chain activity and funding rates—to identify relative value opportunities. For example, a protocol generating substantial fee revenue relative to its market cap may be seen as “cheap” compared with peers; a token whose market cap has run far ahead of its current user base and revenues may be viewed as “expensive,” even if absolute prices are rising. Quantitative strategies sometimes incorporate market cap as a factor in multi‑factor models, exploiting patterns such as size premia or mean reversion across cap tiers, similar to equity factor investing.
Builders, founders and token designers
For protocol teams and founders, market cap is both a performance scoreboard and a strategic constraint. A project’s token market cap affects its ability to raise funds, attract liquidity providers, secure listings on major exchanges and be taken seriously by institutional partners. Teams therefore pay close attention to both circulating market cap and FDV when designing tokenomics, deciding how much of the supply to release at launch, how to structure vesting schedules and how to align incentives between early backers and future users.
Poorly designed tokenomics can saddle a project with a high FDV relative to its actual traction, creating an overhang that depresses token performance and limits the project’s ability to grow into its valuation. Conversely, overly conservative float management can leave tokens illiquid, depressing price discovery and limiting organic growth. Founders increasingly engage analytics providers—such as Cap Labs and similar research platforms—to simulate different supply schedules, market cap trajectories and dilution scenarios, seeking a balance between funding needs, governance distribution and sustainable valuations.
Data providers, AI agents and analytics platforms
As markets become more complex, data providers and analytics platforms have turned market cap from a static number into a dynamic dataset enriched with metadata and categorizations. CoinGecko’s methodology, for example, describes how it aggregates price, volume and liquidity data across multiple exchanges to compute market capitalization, and how it classifies crypto assets into categories such as stablecoins, DeFi tokens and layer‑1s. This taxonomy enables sector‑level market cap analyses and comparative dashboards that investors use to track trends in real time.
AI‑driven agents like CARA extend this further by automating the monitoring of market cap, trading volume and liquidity conditions across hundreds or thousands of newly launched tokens on platforms like Solana launchpads. A user can deploy such an agent, define filters based on minimum market cap, volume and liquidity, and receive alerts when tokens meeting those criteria appear, effectively outsourcing the initial screening process to a crypto‑native AI. In this context, market cap is one of several numerical filters—not the sole arbiter of quality—used to narrow down the universe of opportunities.
Institutional index providers, too, rely on market cap as a building block. CME’s market‑cap‑weighted crypto index futures, for instance, require robust and transparent market cap data for each constituent asset to ensure accurate index tracking and risk management. As the number of token categories grows—from RWAs to restaking tokens to AI‑compute credits—providers may introduce sub‑indices capturing specific sectors, each defined by minimum market cap and liquidity thresholds.
Institutions, regulators and risk managers
For institutions and regulators, market cap is a convenient measure of systemic importance. When evaluating the potential impact of a stablecoin failure, for example, regulators look at the token’s market cap to quantify how many dollars of claims would be affected. When assessing the risk profile of an exchange‑traded fund that holds Bitcoin or a basket of crypto assets, risk managers examine the market caps and liquidity of underlying holdings to estimate tracking error, redemption risk and potential price impact.
Market cap also informs discussions around capital requirements, margining and collateral eligibility. Clearinghouses and derivatives venues may require higher haircuts for smaller‑cap tokens due to their higher volatility and lower liquidity, while accepting large‑cap assets like Bitcoin or major stablecoins at more favorable terms. In cross‑market stress tests, analysts simulate scenarios where the market caps of major crypto assets decline sharply, assessing spillover effects into other asset classes. In all these contexts, market cap is an input into risk calculations rather than a valuation claim, underscoring its role as a practical metric in institutional decision‑making.
Conclusion
Across equities, crypto assets, stablecoins and tokenized RWAs, market capitalization has emerged as a common language for discussing scale, importance and relative size. In traditional finance, it reflects the market’s valuation of a company’s equity, adjusted for free float when used in indices. In crypto, it measures the value assigned by markets to circulating token supplies, allowing Bitcoin, Solana, Tether, USDC and thousands of smaller tokens to be ranked and compared using a consistent numerical framework. Market cap thus underpins daily reporting on price moves, sector rotations and narrative shifts, as well as deeper analyses of protocol economics and ecosystem health.
Yet the apparent simplicity of market cap conceals layers of complexity in how supply is defined, how prices are aggregated and how liquidity conditions affect price informativeness. Variants such as fully diluted valuation and float‑adjusted caps extend the concept but introduce their own interpretive challenges, especially in an environment where tokenomics are diverse and sometimes intentionally opaque. Stablecoin market caps, while mechanically tied to outstanding liabilities, raise questions about reserve quality and regulatory oversight that cannot be answered by numbers alone. Cross‑asset comparisons, meanwhile, are valuable for conveying scale but can be misleading if used to equate fundamentally different forms of value.
For a crypto‑savvy audience, the most productive way to engage with market cap is as a starting point, not an endpoint. A large cap can signal depth and resilience but also complacency or overvaluation; a small cap can offer upside but also illiquidity and manipulation risk. Sector‑level market caps for RWAs, stablecoins and chain‑native tokens reveal the growth of entire on‑chain economies, but they must be contextualized within regulatory developments, macro conditions and technological progress. As tools like Cap Labs, Aethir’s CARA and institutional index products incorporate ever richer data, market cap will continue to be a centerpiece of dashboards and risk models—but it will be interpreted alongside a growing array of complementary metrics.
In that sense, understanding market cap is a prerequisite for making sense of crypto markets, but not a guarantee of insight. Only by combining it with liquidity analysis, tokenomics, on‑chain data and macro context can investors, builders and regulators fully grasp what a given market cap figure is truly telling them—and, just as importantly, what it leaves out.
Outlook
The future of market cap in crypto will likely be defined by three parallel trends. First, as institutional participation deepens and products like CME’s market‑cap‑weighted crypto index futures mature, there will be growing pressure to standardize definitions of circulating supply, float and FDV, reducing discrepancies across data providers and improving the reliability of market cap as an input into regulated products. Second, the expansion of tokenized RWAs, stablecoins and chain‑specific economies will make aggregated market cap metrics increasingly important for understanding how much traditional value has migrated on‑chain and how that value is distributed across networks and instruments, from Solana’s RWA footprint to Ethereum’s dominance in tokenized treasuries.
Third, the rise of AI‑driven analytics and on‑chain data platforms will embed market cap within richer, real‑time models that account for liquidity, holder concentration, protocol revenues and governance structures. In such a world, market cap remains an indispensable headline number, but its interpretation becomes more nuanced, tailored to the specific asset type—whether Bitcoin, a DeFi governance token, a regulated stablecoin like USDC or RLUSD, or a tokenized equity. For a crypto news audience, staying fluent in the evolving language of market cap, and in the caveats that come with it, will be essential to covering the next generation of markets built at the intersection of blockchains and traditional finance.
Latest Market Cap news
Predict.fun Adds Memecoin Prediction Markets for Fees, Listings and Market Cap Using Onchain DataZachXBT calls out MemeCore over $6B market cap and heavy insider control, raising concerns after probing the collapse of its RAVE token ecosystemALERT🚨: Ethereum now faces a 57% probability of losing its position as the second-largest cryptocurrency by market cap this year, signaling rising competition in the crypto market.CME targets June 8 for its first market-cap weighted Nasdaq CME crypto index futures across seven assetsCrypto winter deepens in 2026 Q1 as total market cap drops 20% to 2.4T, BTC falls 22%, CEX volume sinks 39%, while stablecoins stay flat at 310B and oil surges 77% on war tensions.Ark Invest predicts Bitcoin could hit $16T market cap by 2030, driven by accelerating institutional demand and expanding role as a global digital reserve assetSources
- https://www.investopedia.com/terms/m/marketcapitalization.asp
- https://www.coinbase.com/learn/crypto-basics/what-is-market-cap
- https://www.spark.money/tools/market-cap-calculator
- https://www.youtube.com/watch?v=tEq7oZOXG-E
- https://www.investopedia.com/terms/f/freefloatmethodology.asp
- https://www.gemini.com/es/cryptopedia/crypto-market-cap-explained
- https://companiesmarketcap.com/assets-by-market-cap/
- https://kanga.exchange/university/en/courses/intermediate-course/lessons/42-market-cap-versus-fully-diluted-market-cap-the-most-important-differences-you-should-know/
- https://www.coingecko.com/en/methodology
- https://coinmarketcap.com/academy/glossary/market-capitalization-market-cap-mcap
- https://www.cmegroup.com/media-room/press-releases/2026/5/14/cme_group_to_launchnasdaqcmecryptoindexfutures.html
- https://x.com/TheBlockCo/status/2064079762184720417
- https://x.com/elonmusk/status/2061699109527195862
- https://www.kucoin.com/news/trends/BTC/6a2961751b22f90007826e90
- https://www.bitiblocky.com/posts/bitcoin-drops-out-of-top-10-largest-assets-by-market-cap-now-ranked-11th-behind-saudi-aramco
- https://www.mexc.com/news/1100778
- https://www.sciencedirect.com/science/article/abs/pii/S0378426622001418
- https://www.coingecko.com/en/coins/tether
- https://www.coingecko.com/en/coins/usdc
Community notes
Spot something off or out of date? Drop a note. Editors review topic notes daily and roll accepted fixes into the explainer — contributors are recognized in the monthly $SQUID drop.
Loading notes…