
A comprehensive guide to crypto metrics — MVRV, TVL, fees, validator distribution, and more — explaining what each measures, how to use them together, and where they can mislead.
+5 sources across the wider coverage universe
 Variant argues Bitcoin, Ethereum and Zcash should be valued as digital stores of value, citing scarcity, censorship resistance and technical durability as key metrics2026-06
 Solana’s decentralization is stronger than critics claim, with stake distribution, native staking and validator control metrics comparing favorably to Ethereum2026-06
 New framework ranks blockchain ecosystems from thriving to fading, citing tech development, usage metrics, ecosystem adoption and narrative2026-03
 Lido finance unveils “Financial Metrics 101” guide detailing TVL, rewards, treasury, and grants, reinforcing transparency as it leads Ethereum staking with 9.4M ETH locked2026-05
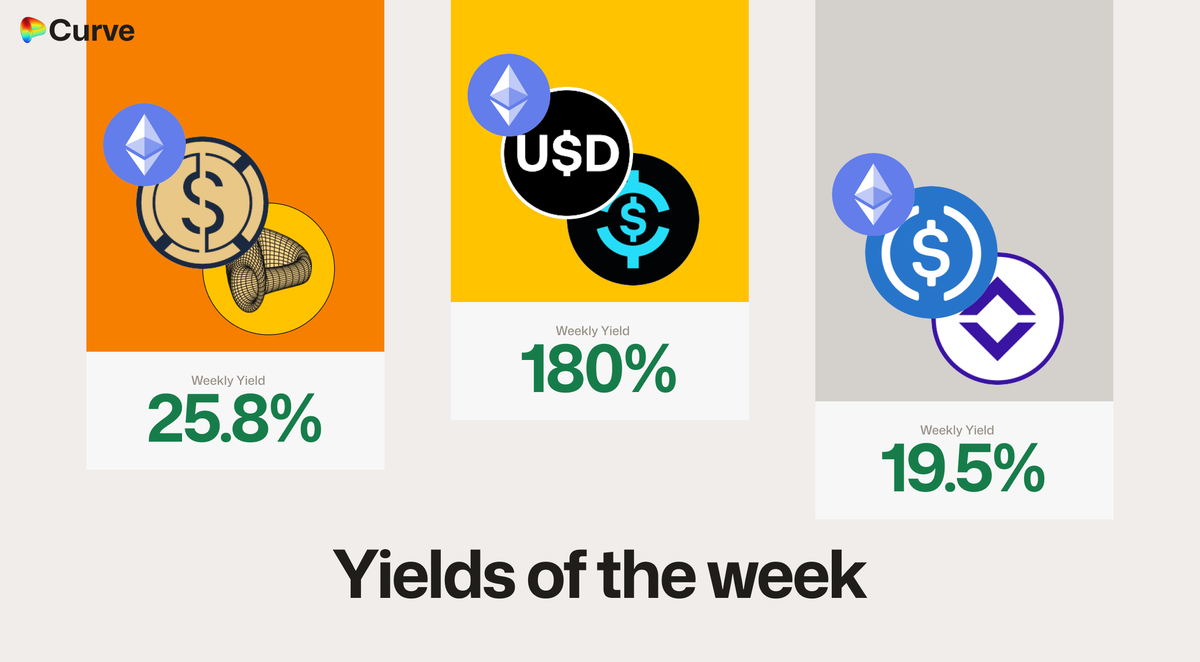 Curve Best Yields & Key Metrics | Week 22, 20262026-05
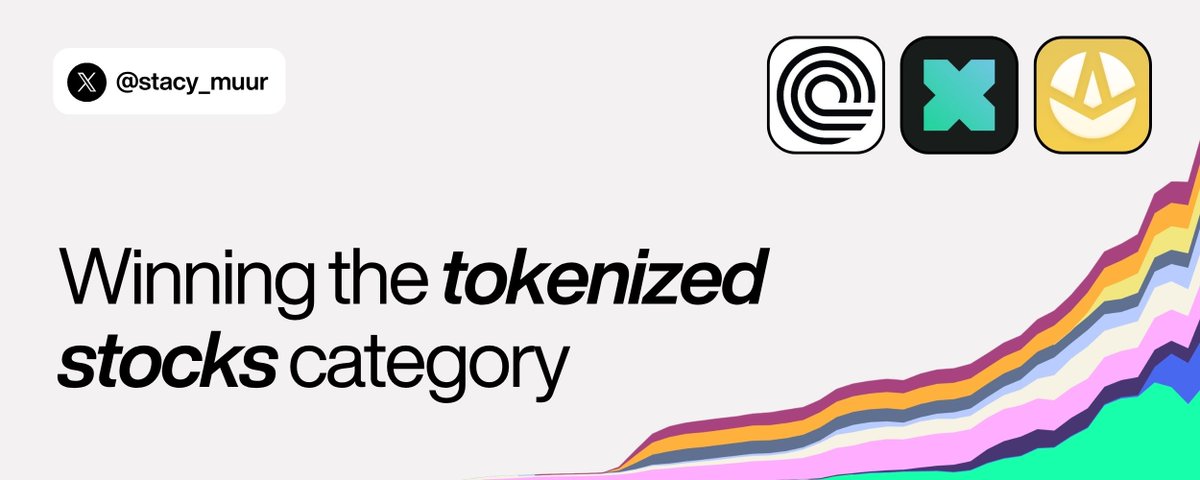 Stacy Muur says tokenized stock markets are being judged on the wrong metrics, arguing platforms like AnchoredFi may outscale Ondo and xStocks through fund products and Asia-focused infrastructure2026-05
Arrr, scribblin' this pillar page now, cap'n — no tool calls needed, me knowledge and the recent coverage be sufficient to chart these waters.
On-chain and off-chain data points that investors, builders, and analysts use to evaluate blockchains, protocols, and tokens — collectively called crypto metrics — have become the primary language through which the industry separates genuine traction from marketing noise.
Crypto native metrics fall into several overlapping families: network health, economic activity, market valuation, and protocol-specific efficiency signals. Understanding what each measures — and, crucially, what each can be gamed or misread — is prerequisite knowledge for anyone navigating digital asset markets.
Why Metrics Matter in Crypto
Traditional equity markets rely on audited financial statements, regulated disclosures, and decades of analytical convention. Crypto has none of those guardrails by default, yet blockchains are uniquely transparent: every transaction is publicly verifiable in real time.
That transparency creates both an opportunity and a hazard. On one hand, analysts can access data that equity investors could never dream of — wallet-level holdings, protocol revenue to the dollar, validator behavior, token unlock schedules. On the other hand, the surface area for misleading metrics is enormous: wash trading inflates volume figures, bot traffic inflates fee counts, and token incentives can temporarily simulate genuine user growth.
The result is an industry where fluency in metrics — knowing which signals are trustworthy, which are lagging, and which are structurally manipulable — is a genuine competitive edge.

Variant argues Bitcoin, Ethereum and Zcash should be valued as digital stores of value, citing scarcity, censorship resistance and technical durability as key metrics

ZEC has 5.11M coins in shielded pools, about 30.6% of circulating supply on zecmetrics, so the censorship-resistance leg is no longer just cypherpunk cosplay. The market still prices SOV through exit liquidity and collateral acceptability: BTC owns that, ETH can route it through staking/DeFi, and ZEC has to prove shielded ownership can survive exchange listings, custody, and borrow markets without leaking the asset graph. ETH's durability case also cuts both ways; the DAO fork and Merge prove the chain can survive major surgery, but they also make social consensus part of the monetary-policy stack.
Readers click 'Metrics' content not for the numbers themselves but when the measurement methodology is contested — whether that's a BIS paper exposing inflated TVL, a stablecoin rating dispute, bot-inflated social scores, or a 30% monthly volume collapse that reframes the prior month's optimism.
Network Health Metrics
Active Addresses and Transactions
Active unique addresses per day and raw transaction counts are the simplest proxies for network usage. They're also among the most gameable — a single actor can spin up thousands of wallets and generate millions of cheap transactions, particularly on low-fee chains.
Context is everything. Solana's daily fee revenue, for instance, fell to around 5,300 SOL in mid-2026 as memecoin launchpad activity declined, illustrating how a single application category can distort headline network metrics. PumpFun's token graduation rate dropped roughly 80% over three months to 0.26%, dragging broader Solana fee and activity metrics with it. This episode is a clean example of why analysts should decompose aggregate activity into source categories before drawing conclusions about network health.
Validator and Stake Distribution
Decentralization is increasingly tracked through quantitative metrics: the Nakamoto coefficient (minimum number of validators needed to collude and halt the network), stake distribution across validators, and geographic concentration. Recent analysis of Solana argued its validator-level stake distribution compares favorably to Ethereum when measured rigorously — a claim that cuts against the common narrative that proof-of-stake networks inevitably centralize. These comparisons require standardized methodology to be meaningful; cherry-picked snapshots can support almost any conclusion.
Developer Activity
Commit counts, unique contributors, and contract deployment rates serve as leading indicators of ecosystem health. Platforms like Dune Analytics, which recently integrated with Flow blockchain, allow analysts to track contract deployments, DeFi usage, and growth across both EVM and native execution environments — precisely the kind of infrastructure that makes cross-chain developer metrics comparable.
Market Valuation Metrics
Market Cap and Fully Diluted Valuation
Market capitalization (circulating supply × current price) is the baseline valuation metric imported from equities. Fully Diluted Valuation (FDV) — total supply × price — is more relevant for tokens with large locked or unvested allocations, since future emissions dilute current holders. The gap between market cap and FDV is itself informative: a high ratio signals significant future supply pressure.
MegaETH's MEGA token illustrates a novel variant — performance-based unlocks that release additional tokens only as network metrics improve, directly tying supply expansion to demonstrated adoption rather than a fixed calendar schedule.
MVRV and On-Chain Valuation Ratios
Market Value to Realized Value (MVRV) compares current market cap to the aggregate cost basis of all coins — the price at which each coin last moved on-chain. MVRV above 3.5 has historically marked cycle tops; MVRV approaching or below 1 has coincided with major bottoms.
The MVRV Z-Score refines this by normalizing the MVRV ratio by its historical standard deviation, producing a signal that adjusts for long-run trend growth. Bitcoin's MVRV Z-Score approaching zero in mid-2026, per Glassnode data, has revived discussion of bear-market bottoms — though analysts note that Long-Term Holder (LTH) and Short-Term Holder (STH) MVRV metrics have not yet converged, a pattern that has historically preceded the actual bottom rather than coinciding with it. The distinction matters: aggregate MVRV and cohort-segmented MVRV can tell different stories simultaneously.
Variant's research framework values Bitcoin, Ethereum, and select other assets as digital stores of value — with scarcity, censorship resistance, and technical durability as the key metrics, deliberately excluding price-to-earnings analogues that imply cash flows these assets don't generate.
Solana’s decentralization is stronger than critics claim, with stake distribution, native staking and validator control metrics comparing favorably to Ethereum
Nakamoto 19 across 4,736 nodes and 460 data centers makes the lazy “one datacenter chain” dunk look stale; the next bottleneck is coordination surfaces, not raw validator count. Ethereum already showed how a huge validator set can still route power through Lido, CEX staking, and a few infra operators. If Solana keeps stake liquid but delegation native, decentralization becomes a throughput moat instead of a vibes debate.
- 01Monthly on-chain volume snapshots
Readers repeatedly returned to periodic summaries showing BTC/ETH volume swings of 10–44%, treating them as a macro pulse check on crypto health.
- 02Stablecoin supply and dominance data
USDT hovering near 78–79% market share and stablecoin adjusted volume crossing $1.41T in a single month made these figures a recurring benchmark readers tracked across reports.
- 03Protocol dashboard releases
Launches of dedicated metric portals — for Ethena, Tether, Balancer, and Curve — drew clicks because they centralized previously scattered risk and yield data into a single view.
- 04Metric integrity and TVL inflation
The BIS 'Verifiable TVL' paper and the Unichain 20:1 scam-volume ratio exposed how standard metrics systematically overstate real economic activity, which cut against bullish narratives readers were already seeing.
- 05Stablecoin rating methodology disputes
The Frax vs. Bluechip debate over which stability metrics actually matter revealed that even credentialed risk frameworks disagree on what makes a stablecoin safe.
- 06Farming and yield metric optimization
Readers engaged with Curve weekly yield reports and perp DEX farming guides because concrete performance numbers let them benchmark their own positions against real protocol output.
DeFi-Specific Metrics
Total Value Locked
Total Value Locked (TVL) measures the dollar value of assets deposited into a protocol's smart contracts. It became the go-to DeFi headline metric during the 2020-2021 cycle and remains widely cited, but it carries well-documented distortions: double-counting across composable protocols, token-price sensitivity (TVL can fall 50% without a single withdrawal if the underlying token drops), and susceptibility to mercenary capital chasing incentives.
Coin Metrics' examination of Aave's infrastructure demonstrates more granular approaches: analyzing utilization rates (borrowed ÷ deposited), interest rate dynamics, and bad debt accumulation separately from headline TVL. These metrics expose whether a lending platform has genuine borrow demand or is primarily a yield-farming destination.
Protocol Revenue and Fee Distribution
The distinction between gross fees paid by users and net revenue retained by a protocol (after paying liquidity providers, stakers, or other stakeholders) is critical. Curve Finance publishes weekly yield and metrics updates — the Week 22, 2026 reports reflect this practice — tracking pool-level APYs, volume, and fee generation. These granular disclosures allow analysts to evaluate whether yields are sustainable from organic trading activity or are effectively subsidized by token emissions.
Lido Finance, with 9.4 million ETH locked as of mid-2026, published a "Financial Metrics 101" guide detailing TVL, staking rewards, treasury flows, and grants — a transparency initiative that sets a benchmark for protocol metric disclosure. Evaluating liquid staking protocols requires understanding the distinction between staking yield (denominated in ETH) and token yield (dependent on LDO price), two figures that can diverge dramatically.
USDC and Stablecoin Velocity
Stablecoin supply and velocity are macro indicators for DeFi liquidity conditions. USDC circulation on a given chain reflects institutional and retail demand for dollar-denominated liquidity in that ecosystem. Rapid growth in on-chain USDC often precedes DeFi activity increases; sharp contractions signal risk-off rotation or regulatory pressure. Analyzing USDC flows across chains provides a capital-flows lens that token price charts alone cannot offer.
Exchange and Liquidity Metrics
Volume and Slippage
Reported trading volume is among the most manipulated metrics in crypto. The CCData Exchange Benchmark — which in its latest edition ranked Robinhood first with a score of 90.26, displacing previous leaders, across 75 exchanges and more than 100 metrics in eight risk categories — exemplifies rigorous multi-dimensional exchange evaluation. The benchmark raised its AA threshold from 80 to 85, reflecting an industry-wide improvement in data quality standards. Slippage on standardized order sizes (often $100k or $1M) is a more reliable liquidity signal than reported volume.
Bid-Ask Spreads and Order Book Depth
Market microstructure metrics — bid-ask spread, order book depth at various price levels, and market impact — tell institutional traders what headline volume figures cannot. A token with $500M in daily volume but thin order books and 2% spreads on $100k orders is far less liquid than those numbers suggest.
New framework ranks blockchain ecosystems from thriving to fading, citing tech development, usage metrics, ecosystem adoption and narrative

It's a good to establish a framework.
- 2024-09milestone
On-chain volume drops 13% to $328B; stablecoin volume falls 30.8%
- 2024-09governance
Token2049 DeGen Summit: 'Professor Crypto' bot-inflation scandal surfaces
- 2024-11milestone
On-chain volume rebounds 29.8% to $255B (ETH +43.9%)
- 2024-12milestone
Stablecoin adjusted volume hits record $1.41T; supply reaches $170B
- 2025-04milestone
On-chain volume falls 30.5% month-over-month
- 2025-11regulatory
BIS working paper introduces Verifiable TVL standard to counter inflated DeFi metrics
- 2025-12launch
Llama Risk launches interactive Ethena Labs risk dashboard with historical metric decay feature
- 2026-02milestone
Hyperliquid reaches $13B daily volume as HYPE holders defy broader sell-off
Emerging and Contested Metric Categories
Probabilistic Risk Scoring for AI Agents
As autonomous agents increasingly interact with DeFi protocols, confidence metrics and risk scoring have become a new research frontier. Analysts have raised concerns about unreliable confidence outputs from probabilistic models operating in volatile protocol environments — a signal-quality problem that has no clean precedent in traditional finance.
Tokenized Asset Metrics
The debate over how to measure tokenized equity and fund products is live. Commentators like Stacy Muur have argued that platforms pursuing tokenized stocks are being evaluated on the wrong metrics — that infrastructure depth, fund product breadth, and geographic reach (particularly Asia) may matter more than raw token issuance volume for determining which platforms scale. This reflects a broader methodological tension: transplanting traditional financial metrics onto novel structures often produces category errors.
Encrypted and Confidential Metrics
Some founders and investors are experimenting with selectively disclosing metrics — sharing burn rates and growth data with vetted counterparties through encrypted channels rather than public dashboards. Platforms built around confidential data flows represent a direct response to the observation that public metric disclosure can disadvantage companies still in competitive formation stages, even as it improves information symmetry at the market level.
Reading Metrics in Context
No single metric is sufficient. The analyst toolkit combines on-chain data (MVRV, active addresses, fee revenue, TVL utilization) with off-chain signals (exchange benchmarks, developer surveys, regulatory filings) and protocol-specific disclosures (weekly Curve yields, Lido financial guides, quarterly reports like Reserve Protocol's Q1 2026 update tracking RSR burn and treasury).
Several principles cut across all metric categories:
Time horizons matter. XRP analysts pointing to three metrics signaling "explosive price expansion" and MVRV Z-Score analysts spotting a potential bottom are making statements about different time frames; conflating them produces confused risk assessments.
Denominator choice is often the real argument. Measuring Solana's decentralization in validators versus staked SOL concentration yields different rankings. Measuring DeFi adoption in TVL versus monthly active users produces different league tables. The choice of denominator often embeds the conclusion.
Incentive structures corrupt metrics. Any metric used to allocate rewards — validator uptime, TVL, engagement scores — will be optimized and eventually gamed. Robust metric design either accounts for this or uses metrics that are harder to manipulate (fee revenue paid by independent parties, for example, is harder to fake sustainably than self-reported volume).
Comparative baselines are required. A 42% revenue growth figure (as Gemini reported alongside its first prediction market metrics) is only meaningful relative to peers, prior periods, and the growth rate of the underlying market. Absolute numbers without comparison frames are marketing, not analysis.
- Data integrityHigh
Inflated TVL, bot-driven social metrics, and a 20:1 scam-volume ratio on Unichain illustrate that headline figures in DeFi are structurally susceptible to manipulation without verifiable on-chain accounting.
- Market / volume volatilityHigh
Monthly adjusted on-chain volume swung from +29.8% to -30.5% within adjacent reporting periods, meaning any single metric snapshot can invert sharply within weeks.
- CentralizationMedium
USDT consistently holds 78–79% of stablecoin supply, concentrating systemic stablecoin risk in a single issuer whose reserves and attestations remain outside on-chain verification.
- LiquidityMedium
Stablecoin adjusted transaction volume can drop 30%+ in a single month even as issued supply grows, signaling that liquidity depth and utilization decouple under stress.
- RegulatoryMedium
Competing rating methodologies for stablecoins and the BIS push for verifiable TVL standards suggest regulators and credentialed risk bodies are actively building frameworks that could reclassify assets currently considered safe.
- Smart-contractLow
Metric dashboards and reporting infrastructure carry minimal direct smart-contract risk, though the underlying protocols whose data they surface (e.g., Curve post-exploit, Ethena) retain their own contract exposure.
Outlook
The metric landscape in crypto is maturing rapidly. Standardization efforts from data providers, more rigorous exchange benchmarking, protocol-level transparency initiatives, and the emergence of cross-chain analytics infrastructure are all reducing the information asymmetry that plagued earlier cycles. At the same time, new complexity — AI agents interacting with protocols, tokenized real-world assets, confidential data markets — is creating new measurement gaps faster than existing frameworks can close them. Analysts who can navigate this environment, distinguishing durable signals from noise, will remain among the most valuable participants in the market regardless of where prices go.
Latest Metrics news
Variant argues Bitcoin, Ethereum and Zcash should be valued as digital stores of value, citing scarcity, censorship resistance and technical durability as key metricsSolana’s decentralization is stronger than critics claim, with stake distribution, native staking and validator control metrics comparing favorably to EthereumNew framework ranks blockchain ecosystems from thriving to fading, citing tech development, usage metrics, ecosystem adoption and narrativeLido finance unveils “Financial Metrics 101” guide detailing TVL, rewards, treasury, and grants, reinforcing transparency as it leads Ethereum staking with 9.4M ETH lockedCurve Best Yields & Key Metrics | Week 22, 2026Stacy Muur says tokenized stock markets are being judged on the wrong metrics, arguing platforms like AnchoredFi may outscale Ondo and xStocks through fund products and Asia-focused infrastructureCommunity notes
Spot something off or out of date? Drop a note. Editors review topic notes daily and roll accepted fixes into the explainer — contributors are recognized in the monthly $SQUID drop.
Loading notes…