
In‑depth explainer on CryptoQuant, the on‑chain and market data platform whose Bitcoin, Ethereum, ETF and derivatives metrics shape today’s
+7 sources across the wider coverage universe
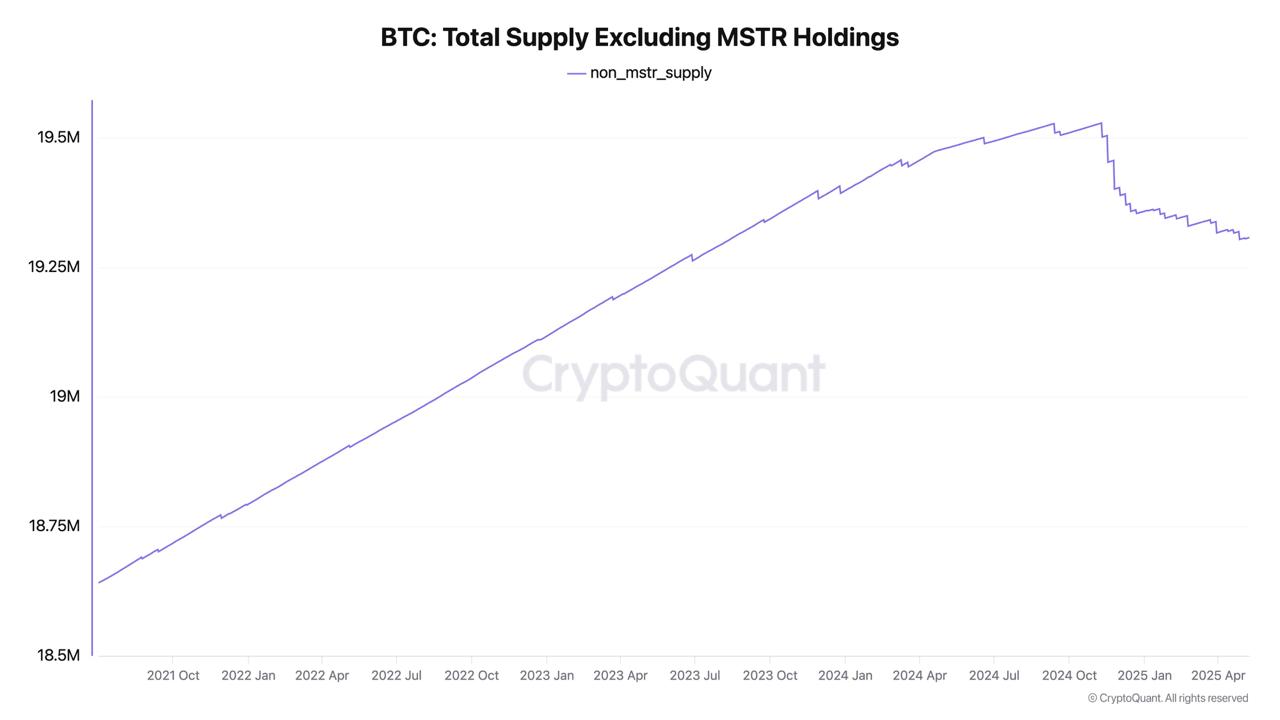 Bitcoin is now effectively deflationary, says CryptoQuant’s Ki Young Ju, as Strategy’s massive BTC purchases—555,000 BTC with no plans to sell—outpace new supply, creating a -2.23% annual deflation rate.2025-05
 CryptoQuant CEO Ki Young Ju admits he was wrong about the bull cycle ending, pointing to how much new liquidity is coming from institutions and ETFs2025-05
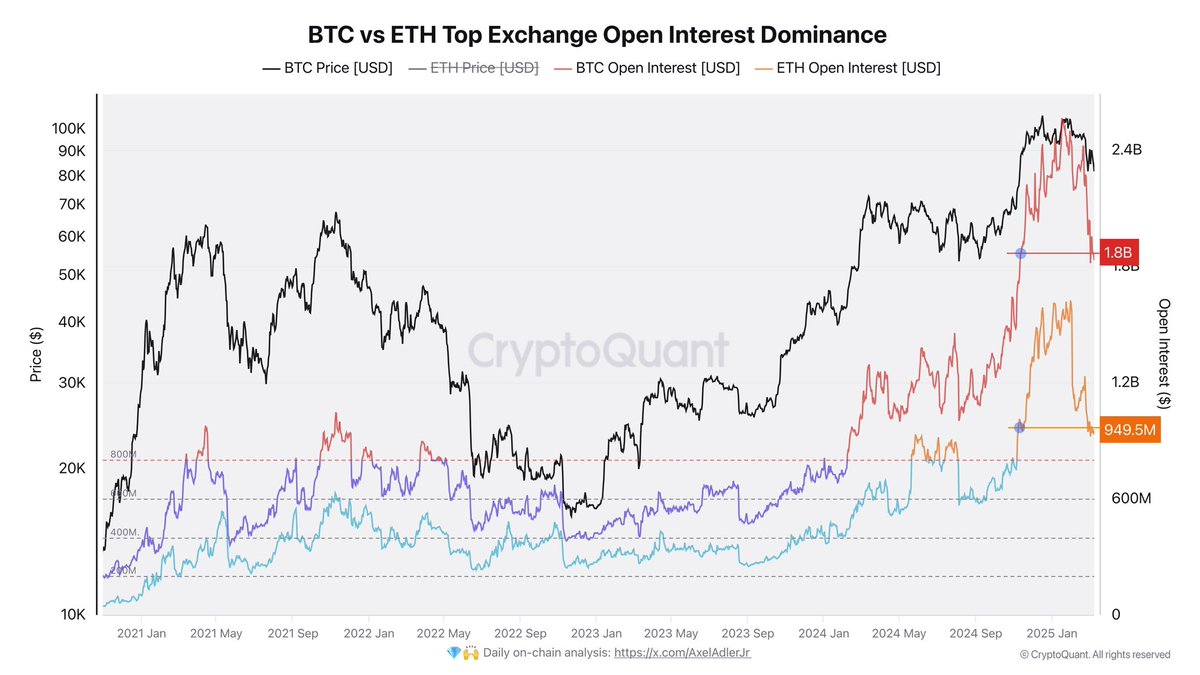 Bitcoin and Ethereum futures open interest drops by $1.37B, signaling a leverage washout and partial market reset, potentially curbing speculation, says CryptoQuant analyst Alex Adler.2025-03
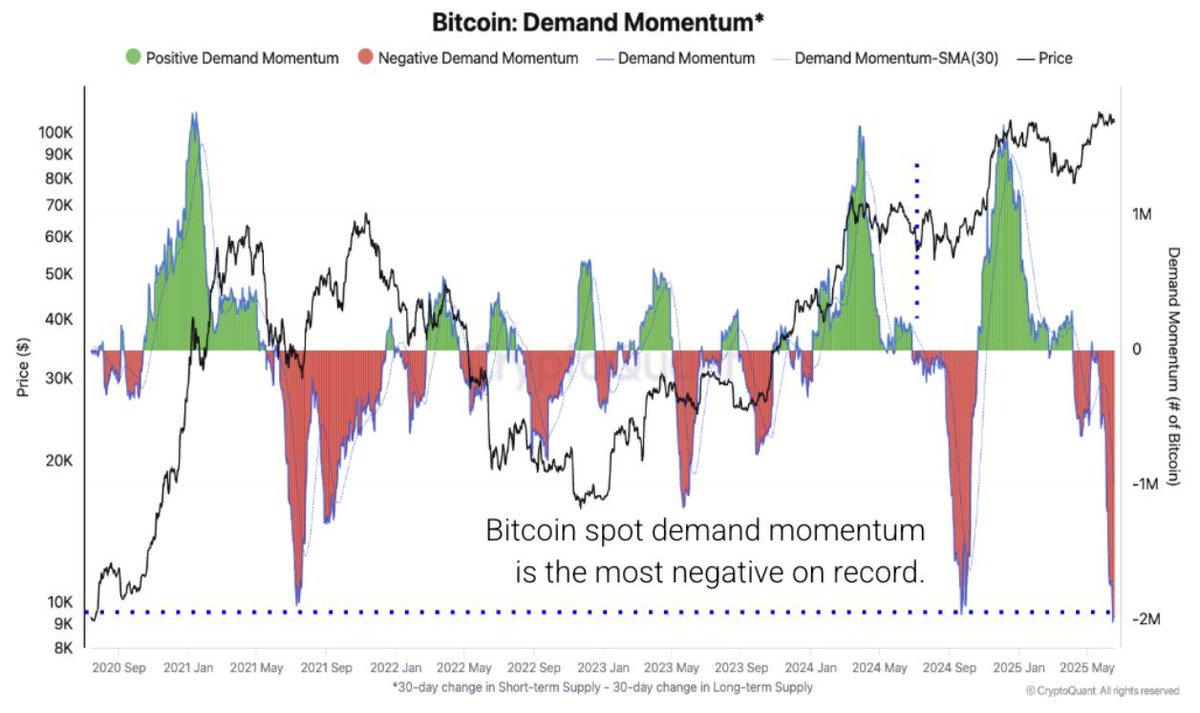 BTC momentum, the worst on record per CryptoQuant.2025-06
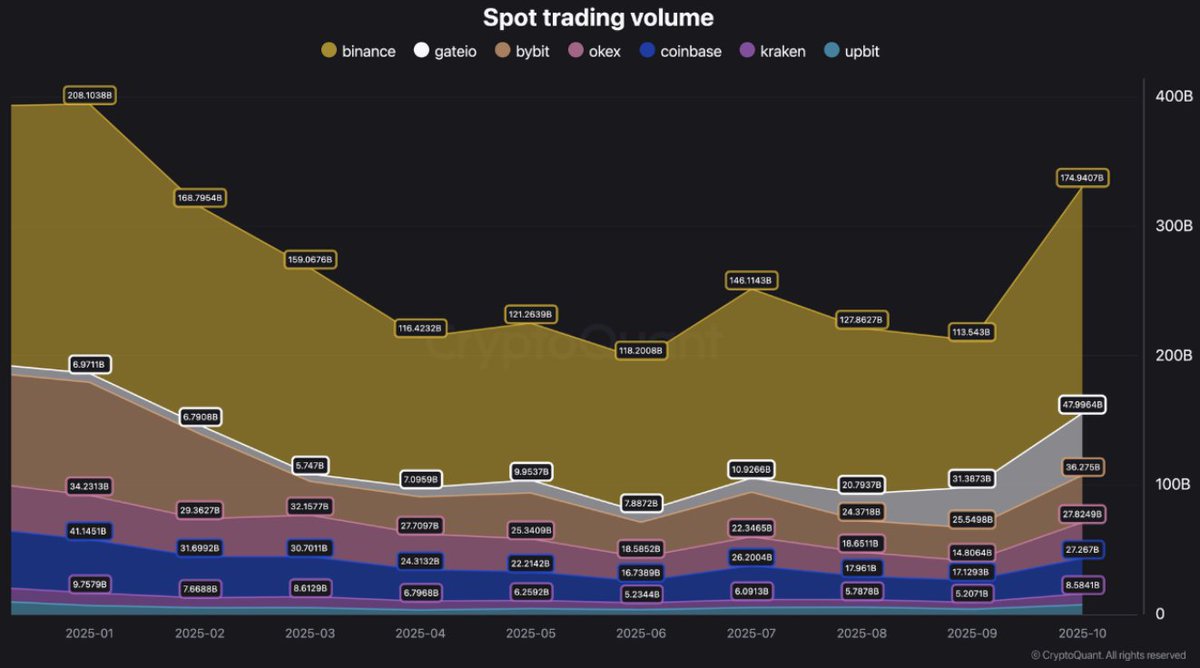 CryptoQuant reports Bitcoin spot trading volume hit an October peak as renewed market participation lifted exchange activity, signaling improving spot conditions and reduced volatility risks.2025-10
CryptoQuant: On-Chain Data And Market Intelligence Explained
CryptoQuant is a digital asset analytics platform that aggregates on‑chain, derivatives, and spot market data to help traders, institutions, and researchers interpret Bitcoin, Ethereum, and broader crypto markets. It has become one of the most widely cited sources for “on-chain actionable insights” in professional crypto trading and research circles.
As digital assets have matured from a niche experiment to a global macro asset class, data vendors like CryptoQuant have become part of the market’s core infrastructure, offering real‑time visibility into how coins move between self‑custody, exchanges, ETFs, and derivatives venues. CryptoQuant distinguishes itself by running its own data pipelines that track every transaction on supported blockchains and label addresses using dusting techniques and machine‑learning heuristics, which in turn underpin metrics such as exchange flows, realized profits, demand indicators, and derivatives positioning. Its research team uses those metrics to frame narratives around key market moments, from Bitcoin demand contractions that rival 2019 lows, to near‑record microtransaction activity on the Bitcoin network, to Ethereum’s so‑called “adoption paradox” in which network usage remains robust even as ETH underperforms. For a crypto news audience, understanding what CryptoQuant is, how its data is constructed, and how its metrics are being used to argue that Bitcoin is facing bear‑market resistance or that Ethereum could revisit \( \sim \$1{,}500 \) is now essential context for reading the daily flow of market commentary.
What Is CryptoQuant?
Positioning In The Crypto Analytics Landscape
CryptoQuant presents itself as a leading provider of on‑chain and market data analytics, explicitly targeting institutions and professional cryptocurrency investors who need robust, defensible data to support trading and risk decisions. Its public website brands the service as a source of “on-chain actionable insights,” emphasizing that the platform is not only a data warehouse but also a layer of interpretation and research built on that data. The company markets an institutional “on-chain market intelligence suite” with fixed and customizable packages designed for businesses of different sizes, signaling that its core customer base includes funds, trading firms, exchanges, and corporate treasuries alongside advanced retail traders. In this sense, CryptoQuant occupies a similar niche to peers such as Glassnode, which likewise offers digital asset market intelligence and on-chain analytics for finance professionals.
Over time, CryptoQuant’s coverage has expanded from a heavy emphasis on Bitcoin to a broader cross‑asset view encompassing Ethereum, major altcoins, stablecoins, and derivatives markets. Bitcoin and Ethereum remain the flagship assets, both because they dominate overall crypto market capitalization and because their UTXO and account-based ledgers are rich sources of behavioral clues for on‑chain analysts. However, exchanges, stablecoins, and derivatives venues now play central roles in price formation, so CryptoQuant integrates data from these off‑chain components as well, creating a picture that spans wallet activity, exchange inflows and outflows, futures and perpetual swaps, and even ETF flows. For a reader trying to interpret a headline like “Bitcoin demand contracts to one of its lowest levels since 2019” or “Binance stablecoin inflows hit a post‑2025 record,” the underlying data almost invariably comes from this kind of multi‑source aggregation.
Because of this breadth and its frequent appearance in media coverage, CryptoQuant has become part of the lingua franca of crypto markets: when analysts argue that Bitcoin’s rebound is just a relief rally, or that network activity is diverging from price, they are often paraphrasing CryptoQuant research notes or chart snapshots. For example, recent reports have cited the firm’s contention that Bitcoin network activity is near record highs even as BTC trades nearly 50% below its cycle peak, largely because micro‑transactions under 0.01 BTC now constitute roughly 80% of daily transactions, up from under half in 2023. Others have relied on CryptoQuant’s demand metrics, which in one recent episode showed a 30‑day demand contraction of roughly 650,000 BTC, one of the weakest readings since 2019, as evidence of renewed bear‑market pressure. As a result, understanding CryptoQuant is not just about understanding one company; it is about understanding a key lens through which much of the industry now views Bitcoin, Ethereum, and the broader crypto cycle.
Data Coverage And Product Offerings
At its core, CryptoQuant ingests and processes three broad families of data: on‑chain transaction data from public blockchains, market data from spot and derivatives exchanges, and flow data involving stablecoins and ETFs. On the on‑chain side, the firm tracks every transaction that occurs on supported networks, then aggregates those raw events into higher‑level metrics such as exchange inflows and outflows, microtransaction counts in different size buckets, realized profits and losses, and various measures of holder behavior. On the market‑data side, it collects order book and trade information from major centralized exchanges, as well as aggregated derivatives indicators such as open interest and funding rates, with dedicated charts showing, for example, Ethereum’s total open interest across listed venues. Finally, it monitors stablecoin flows and, increasingly, ETF holdings and flows, which have become a major pillar of Bitcoin’s demand profile in the United States and other regulated markets.
These raw data feeds are exposed through a web interface that allows users to chart individual metrics, overlay multiple series, and download data, as well as through APIs that institutional clients can plug directly into their trading and risk systems. On top of the data, CryptoQuant maintains an “Insights” portal where staff analysts and external contributors publish long‑form research and shorter “Quicktake” notes that interpret the metrics in the context of current market conditions. The research section has, for example, hosted detailed discussions of Bitcoin microtransaction cohorts and network activity, while the Quicktake stream has covered topics ranging from sudden spikes in Binance stablecoin inflows to the claim that a new bear market has begun based on moving average structures in Bitcoin and Ethereum. This combination of raw dashboards, API access, and human commentary positions CryptoQuant as both a data utility and a research publisher.
For institutional clients, CryptoQuant offers tailored solutions under its “Institutions” umbrella, presenting these as on‑chain market intelligence suites that can be fixed packages or fully customized depending on the needs of the business. These solutions are pitched as suitable for hedge funds, exchanges, Web3 companies, and any organization that requires systematic monitoring of digital asset flows and risk exposures. In practice, that might involve bespoke dashboards that track specific wallets, detailed exchange‑level flow analytics, or integration of on‑chain metrics into traditional risk‑management software. By providing both standardized metrics and custom analytics, CryptoQuant aims to embed itself in the workflows of professional market participants rather than merely serving as a public charting site.
Why CryptoQuant Matters For Market Narratives
CryptoQuant’s importance is amplified by the way its metrics and commentary are woven into broader narratives about Bitcoin and Ethereum’s market cycles. The company repeatedly emphasizes that its goal is to provide “data‑driven insights” rather than pure opinion, and its research frequently frames price action through the lens of supply, demand, and investor behavior gleaned from on‑chain and market data. When the firm argues that a bear market has started, that a Bitcoin rebound is a “relief rally” rather than a new bull cycle, or that Ethereum might revisit the \( \sim \$1{,}500 \) level, it typically does so by pointing to concrete metrics such as moving average structures, realized profit and loss, open interest, and demand contraction.
For instance, in one widely cited Quicktake, CryptoQuant’s technical analysis indicated that short‑term moving averages on both Bitcoin and Ethereum were sloping downward while prices traded below longer‑term moving averages, including the 50‑ and 100‑day SMAs, which the firm interpreted as consistent with a clear bearish trend. In another research note, it described a “wall of resistance” as Bitcoin tested its 200‑day moving average from below while daily realized profits spiked to roughly 14,600 BTC on May 4, 2026, the highest reading since December 10, 2025, suggesting that profit‑taking had begun in earnest. In yet another piece, the firm suggested that Bitcoin’s realized price—roughly the average price at which the current supply last moved on‑chain—sat around \$53,600 and could be viewed as a “valuation bottom candidate,” while stressing through head of research Julio Moreno that this was not a guaranteed cycle bottom. Each of these arguments relies on a mix of technical and on‑chain indicators, illustrating how CryptoQuant’s data stack underpins its narratives.
Because major exchanges, funds, and even ETF issuers operate in both spot and derivatives markets, CryptoQuant’s integration of multi‑venue data also helps contextualize behavior that cannot be seen on‑chain alone. When the firm points to U.S. spot Bitcoin ETF flows that have flattened, or to Bitcoin spot volumes that have surged to monthly peaks on large exchanges, it is effectively telling a story about where and how capital is entering or exiting the market. For a news audience, this means that references to CryptoQuant are often shorthand for a particular kind of analytical framing, one that tries to move beyond surface‑level price moves and into the structural underpinnings of supply and demand.

CryptoQuant reports Bitcoin spot trading volume hit an October peak as renewed market participation lifted exchange activity, signaling improving spot conditions and reduced volatility risks.
Bullish
Readers click CryptoQuant most when its analysts take a macro supply-demand stance that reframes Bitcoin's structural nature — deflation via institutional hoarding, or a CEO publicly reversing a cycle call — not when it issues price-target ranges, which draw near-zero engagement.↗
How CryptoQuant Builds And Interprets Its Metrics
On‑Chain Data Collection And Address Labeling
The foundation of CryptoQuant’s analytics is granular on‑chain data, which requires running full nodes or equivalent data infrastructure for each supported blockchain and parsing every transaction into machine‑readable form. According to its own documentation, CryptoQuant keeps track of every single transaction that occurs in the market, allowing it to reconstruct coin flows from the moment they are mined or created to the moment they are spent or moved between wallets. This is non‑trivial: blockchains like Bitcoin and Ethereum generate vast amounts of data, and extracting meaningful insight requires indexing and updating the entire history of the ledger in near real time.
A critical step in turning raw transaction graphs into market intelligence is address labeling. CryptoQuant reports that it labels addresses using so‑called “dusting” transactions, where very small amounts of cryptocurrency are sent to large numbers of addresses to help cluster them, combined with machine‑learning‑based heuristics that identify patterns characteristic of exchanges, mining pools, institutional custodians, and other entities. For example, exchange hot wallets tend to receive a large number of deposits, consolidate them, and then forward coins to cold storage, often following recurring patterns that algorithms can detect. Miner wallets exhibit periodic inflows from coinbase transactions and subsequent sales or transfers. By training models on such patterns, CryptoQuant can assign labels like “exchange,” “miner,” or “whale” to large portions of the address space, which then enables higher‑order metrics such as exchange inflow/outflow, miner selling pressure, or whale accumulation.
Of course, address labeling is inherently probabilistic and incomplete. Not every entity’s addresses can be identified, and sophisticated actors may deliberately obfuscate their behavior. CryptoQuant’s use of dusting and machine learning is designed to improve coverage and accuracy, but the company itself acknowledges that there is a trade‑off between coverage and certainty and that address labels are subject to refinement over time. For users, this means that metrics based on labeled addresses—such as exchange inflows or miner reserves—should be interpreted as high‑quality estimates rather than perfectly precise counts. Nevertheless, for many purposes, these estimates are sufficient to detect flows of market‑moving size, such as large transfers to or from major exchanges or sudden changes in miner selling patterns.
Metric Families: On‑Chain, Spot, Derivatives, Stablecoins
Once raw transactions have been parsed and addresses labeled, CryptoQuant aggregates them into an array of metrics that fall into several major families: on‑chain activity and holder behavior; spot market flows and volumes; derivatives positioning; and stablecoin and ETF flows. On the on‑chain side, the firm produces indicators on how BTC and ETH move between self‑custody and exchanges, how long coins have remained dormant, how much profit or loss is being realized by holders, and how transaction sizes are distributed across different cohorts. Its research on Bitcoin microtransactions, for example, divides daily transactions into buckets such as sub‑0.001 BTC and 0.001–0.01 BTC, and has shown that transactions below 0.01 BTC now account for around 80% of all daily Bitcoin transactions, up from under 50% in 2023. Such metrics provide insight into whether network activity is being driven by large institutional transfers or by a proliferation of smaller payments and technical operations.
On the spot market side, CryptoQuant tracks exchange inflows and outflows of major assets, as well as aggregate spot trading volumes, using its labeled exchange addresses and exchange‑reported volume data. Net inflow metrics help identify episodes when large quantities of BTC or ETH are being sent to exchanges—often interpreted as potential selling pressure—or withdrawn from exchanges back into self‑custody, often interpreted as accumulation. The firm also monitors exchange‑specific flows and stablecoin movements; for instance, in one Daily Market Update, it highlighted that Binance recorded a net inflow of approximately \$2.2 billion in USDT on a single day, which it described as the largest one‑day stablecoin inflow since November 2025 and notable because it followed weeks of relatively quiet capital movement. Such a spike in fresh stablecoin deposits can be interpreted as latent buying power entering the exchange ecosystem, although it does not reveal in advance whether participants will direct that liquidity into Bitcoin, Ethereum, altcoins, or leveraged derivatives.
Derivatives metrics are another pillar of CryptoQuant’s offering, with open interest being one of the most closely watched indicators. In its user guide, CryptoQuant defines open interest as the amount of open positions—both long and short—currently on a derivative exchange’s BTC/USD trading pairs, noting that a large value of open interest can indicate increased volatility in the price of Bitcoin. The firm provides charts of open interest for Bitcoin and Ethereum across multiple exchanges, giving users a way to monitor when speculative positioning is building up or being unwound. It emphasizes that open interest alone does not indicate market direction, but that sudden increases in open interest, particularly when combined with skewed funding rates or basis, can signal crowded trades that are vulnerable to liquidation cascades.
Finally, CryptoQuant has expanded into tracking flows involving stablecoins and ETFs, reflecting the growing importance of these instruments in crypto’s market structure. On the ETF side, the firm monitors net flows into U.S.-based spot Bitcoin ETFs and incorporates those into broader demand metrics, allowing it to comment on phases when ETF demand is robust, flattening, or outright negative. On the stablecoin side, it tracks flows of tokens such as USDT and USDC to and from exchanges, interpreting large net inflows as injections of trading capital and large net outflows as risk‑off moves into self‑custody or off‑exchange venues. Together with on‑chain and derivatives data, these stablecoin and ETF metrics provide a rounded view of market liquidity.
Research, Commentary, And Caution
CryptoQuant does not stop at providing data; it also publishes a steady stream of analysis through its “Research” and “Quicktake” sections, which are central to how the broader market encounters its metrics. The research arm produces deeper dives that explore structural themes—such as the implications of rising microtransaction counts on Bitcoin or the disconnect between Ethereum’s network usage and its price—while the Quicktake channel offers shorter commentary on fast‑moving events, like a sudden surge in Binance stablecoin inflows or a technical rejection of Bitcoin at a key moving average. These analyses often bring together multiple data families, combining on‑chain metrics like realized profit and loss with derivatives metrics like open interest and spot indicators like ETF flows to build a coherent narrative.
A recurring theme in CryptoQuant’s research is caution about over‑interpreting any single metric. When the firm suggested that Bitcoin’s realized price of roughly \$53,600 might represent a valuation bottom candidate, for example, head of research Julio Moreno explicitly stressed that this did not necessarily mark the cycle bottom and should instead be viewed as one potential reference point in a broader valuation framework. Similarly, in its open interest user guide, CryptoQuant notes that while high open interest often accompanies significant price swings, it is best used in conjunction with other indicators to identify potential market tops and bottoms. This emphasis on multi‑metric confirmation is important, because on‑chain and derivatives data can be noisy and sometimes yield conflicting signals.
Yet CryptoQuant’s commentary can also be forceful when multiple indicators align. In a Quicktake that argued a bear market had started, the firm pointed to short‑term SMAs on Bitcoin and Ethereum sloping downward in tandem with prices trading below longer‑term SMAs, as well as negative reactions at key resistance levels, as evidence of a clear bearish trend. In another report that described a “wall of resistance,” it combined the rejection of Bitcoin at its 200‑day moving average with a sharp spike in realized profits to argue that profit‑taking had kicked in and could cap further upside. In coverage of demand contraction episodes, it has highlighted both the sheer scale of net BTC demand declines—on the order of hundreds of thousands of coins over 30 days—and the cooling of ETF demand growth as signs that fresh buying interest was waning. For market participants, these research notes serve both as interpretation of the current cycle and as examples of how to use the underlying metrics.
- 01Strategy BTC deflation thesis↗
The claim that one corporate buyer's 555,000 BTC stockpile now outpaces new issuance — flipping Bitcoin net-deflationary — reframed the supply narrative in a way readers hadn't seen quantified before.
- 02Ki Young Ju cycle-call reversal↗
A founder publicly admitting a major directional error and attributing the miss to underestimating ETF and institutional liquidity is rare institutional accountability that cuts through analyst noise.
- 03Leverage washout open interest↗
A $1.37B single-day drop in BTC and ETH futures open interest provided a concrete, actionable reset signal that readers use to gauge whether speculation has been flushed.
- 04BTC momentum extremes↗
A 'worst momentum on record' framing carries urgency that abstract price-target articles lack — readers respond to superlatives tied to historical data.
- 05Spot volume recovery signals↗
Rising spot volume (versus derivatives-led moves) is read as a healthier demand signal, and CryptoQuant's framing of an October peak gave readers a bullish counter-narrative to leverage-risk headlines.
- 06ETH adoption paradox↗
The disconnect between Ethereum network growth and price underperformance — with a $1,500 downside target — tapped into a long-running debate about whether ETH's utility is priced in.
Reading Bitcoin Through CryptoQuant’s Lens
Demand, Supply, And Valuation Bottoms
One of the most prominent ways CryptoQuant’s analysis of Bitcoin enters the public conversation is through its efforts to quantify demand and to relate price to measures of “fair value” based on on‑chain data. A cornerstone of this approach is the concept of realized price, which can be thought of as the average price at which each unit of Bitcoin last moved on‑chain, giving a kind of cost basis for the market as a whole. When spot price trades significantly below realized price, some analysts view that as an indication of undervaluation and potential capitulation, while when spot trades well above realized price, it may signal overheated conditions. CryptoQuant has embraced this framework and integrated realized price into its assessments of where Bitcoin might find support in a downtrend.
In a widely circulated example, CryptoQuant pointed out that Bitcoin’s realized price was then around \$53,600 and suggested that this level might represent a potential valuation bottom, since historically deep cyclical lows have often formed in the vicinity of realized price. However, the firm’s head of research Julio Moreno was careful to describe this as only a “valuation bottom candidate,” highlighting that realized price is a statistical construct rather than a magical floor and that macroeconomic factors, liquidity conditions, and regulatory shocks can still drive spot prices below such levels. At the same time, CryptoQuant’s broader demand indicators painted a picture of weakening appetite: in one assessment, the firm noted that total Bitcoin demand had fallen by more than 650,000 BTC over a 30‑day window, with ETF demand growth over the previous 30 days turning negative by tens of thousands of BTC, signaling that new capital flows were not offsetting selling pressure.
The firm’s demand metrics are built from a combination of on‑chain flows, exchange data, and ETF flows, and they allow CryptoQuant to categorize periods as demand expansion, neutrality, or contraction. In the case where demand contracted by roughly 650,000 BTC over 30 days, CryptoQuant highlighted that this reading was among the lowest since 2019, a period associated with deep bear‑market exhaustion and a lengthy bottoming process. The firm also noted that realized losses incurred by holders over the prior 30 days remained below the levels historically associated with full‑scale capitulation, suggesting that while price and demand dynamics were deteriorating, a classic wash‑out of weak hands might still lie ahead. This combination—realized price as a candidate support, demand metrics showing extreme contraction, and realized losses still short of capitulation—underpinned the firm’s nuanced message: the market might be approaching a value zone but was not yet through the worst of the cycle.
Short‑term holder behavior is another layer in CryptoQuant’s analysis. In one case, external reporting on CryptoQuant data noted that short‑term holders (STHs) had shed roughly 800,000 BTC since late May, with an associated momentum metric registering around minus 2 million BTC, described as the worst on record. STHs, typically defined as entities that have held coins for fewer than about five months, are often considered more sensitive to price fluctuations and more likely to capitulate during drawdowns. When STHs offload large amounts of BTC in a relatively short period, especially in the context of shrinking new demand, CryptoQuant interprets this as a sign of stress and potential risk of further downside. At the same time, such selling can be part of a process of transferring coins from weaker to stronger hands, which, if it continues, may eventually support a new accumulation phase.
All of these elements feed into CryptoQuant’s cyclical valuation narratives. On the one hand, realized price and extreme demand contraction readings are used to argue that Bitcoin is moving into a zone where future returns might improve for long‑term holders. On the other hand, the firm’s own caveats—that realized price is not a guaranteed floor, that realized losses have not yet matched prior capitulation episodes, and that major holders have sometimes paused net accumulation—underscore that such metrics should enhance, not replace, traditional risk management. In practice, CryptoQuant’s valuation frameworks are best viewed as probabilistic tools that help investors reason about where they are in the cycle, rather than as precise forecasting devices.
Spot Flows, ETFs, And Demand Regimes
CryptoQuant’s demand analysis is closely tied to how it interprets spot flows and ETF behavior. U.S.-based spot Bitcoin ETFs, which hold physical BTC on behalf of shareholders, have become a major conduit for institutional and retail participation, and their flows provide a window into regulated‑market sentiment. CryptoQuant tracks these flows and has highlighted episodes when ETF demand growth slowed dramatically or turned negative over a 30‑day horizon, arguing that such shifts signal waning appetite from key investor cohorts. In one commentary, the firm’s data showed that U.S. spot Bitcoin ETF flows had stabilized after a period of strong inflows, and this flattening was described as evidence of plummeting interest in Bitcoin’s recent demand, even as price remained elevated. When ETF demand growth drops into negative territory—meaning redemptions or lack of new inflows—the firm incorporates that into its broader classification of demand regimes.
Spot exchange volumes and flows add another layer. In its institutional commentary, CryptoQuant has pointed to phases when Bitcoin spot trading volume on major exchanges rises to local peaks, signaling renewed market participation and, potentially, healthier price discovery after illiquid conditions. Rising spot volumes can be a sign that sidelined traders are returning, particularly when accompanied by stablecoin inflows that represent fresh capital. Conversely, when spot volumes and net exchange inflows both drop, it can indicate that markets are drifting on low conviction, making them more vulnerable to sharp moves driven by derivatives liquidations or isolated large orders.
CryptoQuant has also offered assessments of profit‑taking behavior using realized profit metrics. In a mid‑2026 report, the firm noted that daily realized profits spiked to about 14,600 BTC on May 4, the highest reading since December 10, 2025. This spike occurred as Bitcoin approached and tested its 200‑day moving average from below, leading CryptoQuant to describe a “wall of resistance” where profitable holders were increasingly willing to sell into strength. Combined with evidence of slowing ETF flows and softening demand growth, the firm argued that this uptick in profit‑taking could cut short the ongoing rally, reframing it as a bear‑market bounce rather than the start of a new sustained bull trend. Subsequent commentary from the firm and from news outlets drawing on its data framed Bitcoin’s rebound as a “relief rally” amid high profit‑taking risk, rather than a definitive reversal of the downtrend.
Taken together, ETF flows, spot volumes, and realized profit metrics enable CryptoQuant to segment the market into phases such as accumulation, distribution, and complacent uptrend. When ETF inflows are strong, spot volumes are rising, and realized profits are modest relative to previous peaks, the firm may characterize demand as healthy and rallies as potentially sustainable. When ETF flows flatten, spot volumes stagnate or become dominated by exchange net inflows that suggest selling pressure, and realized profits spike near technical resistance, CryptoQuant’s commentary tends to turn cautious, warning about bear‑market rallies or potential breakdowns.
Network Activity And The Microtransaction Surge
One of the most striking recent themes in CryptoQuant’s Bitcoin research is the surge in microtransactions and the resulting disconnect between on‑chain activity and price. By categorizing Bitcoin transactions by size, the firm found that transactions below 0.01 BTC—equivalent to a few hundred dollars at typical exchange rates—have grown to represent around 80% of all daily transactions, a dramatic shift from 2023, when their share was under 50%. Within that bracket, the sub‑0.001 BTC cohort has seen particularly rapid growth, indicating an explosion of very small transfers. CryptoQuant highlighted this trend in a June 18, 2026 research note, describing near‑record microtransaction counts that were driving overall network activity.
The same report noted that OP_RETURN opcode usage—an instruction in the Bitcoin scripting language often used to embed arbitrary data in transactions—had also surged, suggesting that a significant portion of the increased activity might be related to data inscriptions, metadata storage, or other non‑standard uses of the blockchain. This pattern aligns with broader market developments, such as the rise of Bitcoin Ordinals and other inscription protocols that create NFT‑like assets on Bitcoin by attaching data to individual satoshis. Although CryptoQuant’s research snippets do not spell out all of these use cases, the combination of many tiny outputs and increased OP_RETURN usage is a strong signal that technical or experimental applications are driving much of the activity, rather than large payments or institutional transfers.
Crucially, this microtransaction boom has occurred during a period when Bitcoin’s price has traded nearly 50% below its cycle peak, underscoring that high network activity does not automatically translate into bullish price action. In its commentary, CryptoQuant has framed this as evidence of an evolving use case for the Bitcoin network: while speculative cycles may ebb and flow, underlying technological experimentation and smaller‑scale transactions can continue to grow, leading to a kind of structural baseline in on‑chain activity. At the same time, the firm cautions that microtransaction counts alone are not a proxy for new user adoption, since many of these transactions may be generated by automated systems, consolidating wallets, or inscriptions that do not represent traditional economic activity. For traders and investors, the key lesson is that simple metrics like “number of transactions” must be contextualized by size distributions and opcode usage to avoid misleading conclusions.
This nuanced view of network activity feeds back into CryptoQuant’s broader narrative about Bitcoin’s health. On the one hand, near‑record microtransaction counts and rising OP_RETURN usage suggest that developers and power users are actively experimenting with new use cases on the base layer. On the other hand, the fact that these experiments can coincide with severe price drawdowns—and even with episodes of extreme demand contraction—highlights the complexity of the Bitcoin ecosystem, where technological metrics and market metrics may diverge for extended periods. For a news audience, this is an important corrective to simplistic tropes that equate network activity directly with price or that assume declining prices must reflect collapsing usage.
Bear Markets, Resistance Zones, And Cycle Context
CryptoQuant’s blend of on‑chain and technical analysis is particularly visible in its treatment of bear markets and resistance zones. In one Quicktake, the firm argued that a new bear market had started by pointing to the alignment of several technical signals on both Bitcoin and Ethereum. Short‑term simple moving averages (7‑, 14‑, and 30‑day) were sloping downward, while prices were trading below medium‑term SMAs (50‑ and 100‑day), creating a bearish moving average stack. In addition, price reactions at key levels had become more negative, with rallies failing at previous support zones. CryptoQuant interpreted this pattern as indicative of a clear bearish trend, in which rallies should be treated with skepticism unless and until the moving averages re‑align in a more bullish configuration.
Another illustrative case was the firm’s “Wall of Resistance” research on May 13, 2026, in which it analyzed Bitcoin’s attempt to break above its 200‑day moving average. CryptoQuant observed that Bitcoin had tested this long‑term trendline from below but failed to sustain a breakout, coinciding with a sharp spike in daily realized profits to around 14,600 BTC on May 4, the highest reading since late 2025. The firm argued that this combination—a key technical level acting as resistance and a surge in profit‑taking—suggested that many holders who had ridden the prior rally were seizing the opportunity to de‑risk, potentially capping further upside. This analysis supported the view that the ongoing rebound was a relief rally within a broader downtrend, rather than the start of a new bull market, a framing that would later appear in news headlines referencing CryptoQuant’s assessment.
CryptoQuant has also offered forward‑looking ranges for where Bitcoin rallies might encounter resistance. In one piece of coverage, the firm suggested that Bitcoin’s rally could face significant overhead supply between roughly \$75,000 and \$85,000, identifying the upper end of that band as the next major resistance level. This range was likely derived from a combination of prior price congestion, realized price bands, and on‑chain measures of where large cohorts of holders had acquired their coins, although the exact methodology was not fully detailed in public snippets. The implication was that even if Bitcoin managed to recover from intermediate drawdowns and push higher into the low \$80,000s, it might struggle to sustain a breakout unless demand metrics improved and profit‑taking subsided.
These analyses illustrate how CryptoQuant situates individual rallies and corrections within the broader context of trend structures and supply‑demand imbalances. When moving averages are aligned bearishly, realized profits are spiking into resistance, demand is contracting, and short‑term holders are unloading coins, the firm tends to characterize upside moves as precarious rallies vulnerable to reversal. When, by contrast, moving averages flatten, realized losses spike, demand begins to recover from extremely low levels, and coins move from short‑term to long‑term holder cohorts, CryptoQuant’s commentary often shifts toward accumulation and bottoming narratives. For readers, this underscores the firm’s central message: on‑chain and technical data are most powerful when synthesized, not used in isolation.
Liquidity, Stablecoins, And Spot Volumes
Liquidity is another major theme in CryptoQuant’s Bitcoin analytics, and stablecoin flows play a central role in how the firm gauges it. In March 2026, CryptoQuant’s Daily Market Update highlighted that Binance, the world’s largest cryptocurrency exchange by trading volume, had recorded a net inflow of approximately \$2.2 billion in USDT on March 18. The firm described this as the largest single‑day stablecoin inflow since November 2025 and noted that it ended a prolonged period of relatively subdued capital movement on the exchange. Because stablecoins like USDT are widely used as base currency for trading pairs, such large inflows are often interpreted as dormant capital being redeployed into the market, providing fuel for future trading activity.
However, CryptoQuant is careful to stress that stablecoin inflows are a necessary but not sufficient condition for price rallies. A surge of USDT onto Binance tells us that traders and institutions have moved funds to the exchange, but not whether they intend to buy Bitcoin, accumulate altcoins, short the market via derivatives, or simply park liquidity in preparation for future opportunities. Consequently, the firm typically pairs stablecoin flow analysis with spot volumes, derivatives positioning, and on‑chain flows. When stablecoin inflows coincide with rising spot volumes, increasing open interest, and net BTC inflows to exchanges, the picture looks more like a risk‑on rotation that could drive higher prices, albeit with greater volatility. When stablecoin inflows are offset by net outflows in BTC and ETH or by rising short interest, the interpretation shifts.
Bitcoin spot volumes themselves have been a focus of CryptoQuant’s commentary. In some periods, the firm has noted that spot trading volumes on major exchanges have risen to multi‑month peaks, signaling improved liquidity and reduced risk of sudden price dislocations driven by thin order books. Higher spot volumes, especially when accompanied by balanced or modestly positive ETF flows, can support a healthier price discovery process in which moves are less easily dominated by leveraged derivatives. Conversely, low spot volumes combined with high open interest in futures and perpetual swaps can indicate a market that is structurally fragile, where relatively small catalysts can trigger outsized volatility via liquidation cascades.
Altcoin and cross‑asset flows further nuance the liquidity story. CryptoQuant’s analysts have reported that altcoin spot markets have undergone an extended period—on the order of 15 consecutive months—of net selling pressure, with cumulative buy‑sell volume differences reaching five‑year extremes. While this particular observation comes from newsroom coverage rather than the search snippets, it aligns with the firm’s broader finding that investors have been de‑risking in the altcoin sector while rotating toward Bitcoin, stablecoins, or cash. In that context, stablecoin inflows to Bitcoin‑heavy exchanges like Binance may partly reflect capital migrating away from altcoins and into more established assets. For a news audience, the bottom line is that CryptoQuant’s liquidity metrics help explain not just whether liquidity is entering or leaving crypto, but also how it is being redistributed across Bitcoin, Ethereum, and the long tail of altcoins.
BTC momentum, the worst on record per CryptoQuant.
Binance records $2.2B single-day USDT inflow, largest since Nov 2025
Ki Young Ju publicly reverses bear-cycle call, cites ETF and institutional liquidity
CryptoQuant research: Bitcoin tests 200-day MA amid profit-taking wall of resistance
CryptoQuant flags ETH adoption paradox, projects $1,500 downside if bear market persists
CryptoQuant reports near-record Bitcoin micro-transaction surge as network activity rises
CryptoQuant suggests Strategy pause BTC accumulation and rebuild cash reserves
Beyond Bitcoin: Ethereum, Altcoins, And Derivatives
Ethereum’s “Adoption Paradox”
While Bitcoin remains the centerpiece of CryptoQuant’s analytics, the firm has devoted increasing attention to Ethereum, particularly in the context of what it describes as an “adoption paradox.” In one notable piece of research, CryptoQuant projected that Ethereum’s price could fall to around \$1,500 by late Q3 or early Q4 2026 if bear‑market conditions persisted. This projection came at a time when ETH had already fallen more than 50% from its cycle peak, underscoring the depth of the drawdown. The paradox, as described by the firm, is that Ethereum’s fundamental usage metrics—such as daily active addresses, transaction counts, and smart contract activity—have remained relatively robust, or even improved, while price performance has lagged significantly behind both prior cycles and some expectations.
CryptoQuant’s analysis highlighted what it called a severe disconnect between network adoption and price performance, suggesting that traditional valuation frameworks linking on‑chain usage to token price might need to be revisited for Ethereum. Several factors could contribute to this disconnect. For one, a significant share of Ethereum’s economic activity has migrated to layer‑2 networks, where transactions may not be fully captured in base‑layer metrics, complicating simple interpretations of on‑chain data. Additionally, structural changes such as staking, fee burns, and the transition to proof‑of‑stake have altered ETH’s supply dynamics, which can both support long‑term bullish narratives and introduce near‑term selling pressure as stakers, validators, and early investors realize gains or rebalance portfolios.
In some market commentary inspired by CryptoQuant’s research, analysts have framed a potential drop toward \$1,500 as a “treasure cove” for long‑term ETH investors, arguing that the adoption paradox implies underpricing of Ethereum’s underlying network value. While that narrative leans more optimistic than CryptoQuant’s own cautious tone, it demonstrates how the firm’s identification of a disconnect between usage and price can feed into different investment theses. From a neutral standpoint, the key takeaway is that on‑chain adoption metrics alone did not prevent ETH from undergoing a severe bear‑market drawdown, and that investors must consider macro conditions, regulatory risk, and sector‑specific sentiment alongside network data.
CryptoQuant’s focus on the adoption paradox also underscores the importance of distinguishing between different types of on‑chain activity. Not all addresses are equal: some may belong to exchanges, staking services, or bots, while others are end‑user wallets. Likewise, not all transaction volume reflects genuine economic exchange; some portion is internal accounting, MEV‑related activity, or low‑value interactions. By combining on‑chain usage metrics with exchange flows, derivatives positioning, and realized profit and loss, CryptoQuant aims to develop a more nuanced picture of how adoption translates—or fails to translate—into price.
Bitcoin And Ethereum Derivatives Positioning
Derivatives markets for Bitcoin and Ethereum have grown enormously, and CryptoQuant’s metrics for open interest and related indicators are central to its analysis of risk appetite and potential liquidation events. As the firm explains in its user guide, open interest (OI) is defined as the number of open positions—long and short—currently active on a given derivative exchange’s BTC/USD trading pairs. An increase in open interest indicates that new positions are being opened faster than old positions are being closed, while a decrease indicates net position closures. CryptoQuant notes that large values of open interest can be associated with increased price volatility, especially when positions are highly leveraged, because they create fuel for cascades of forced liquidations.
For Ethereum, CryptoQuant provides dedicated charts tracking total open interest across major derivatives exchanges, giving users a consolidated view of how much ETH is tied up in futures and perpetual swap contracts at any given time. By comparing Bitcoin and Ethereum open interest, analysts can infer where speculative activity is concentrated and how risk appetite shifts between the two leading assets. For instance, when both BTC and ETH open interest surge simultaneously, news coverage drawing on CryptoQuant data has described it as a “rising tide” of derivatives exposure, signaling renewed risk‑on sentiment among traders. However, CryptoQuant has also warned that such rallies, when accompanied by skewed funding rates and heavy long positioning, can resemble “sailing on risky long positions in perpetual futures,” leaving the market vulnerable to “liquidation storms” if prices move sharply against crowded trades.
The firm’s guidance emphasizes that open interest should not be interpreted mechanically as bullish or bearish. Rising open interest during a price uptrend could signify aggressive long positioning, but it could also mean that short sellers are increasingly confident. Conversely, declining open interest can signal profit‑taking, de‑risking, or short‑covering, depending on context. CryptoQuant therefore encourages users to combine OI with other metrics such as funding rates, estimated leverage ratios, and realized profit/loss to gauge positioning imbalances. When OI is high, funding rates are strongly positive, and realized profits are spiking into resistance zones—such as the \$75,000–\$85,000 band that CryptoQuant has identified as a potential overhead area for Bitcoin—the firm tends to warn of elevated downside risk if a correction triggers forced unwinds.
For Ethereum, derivatives positioning plays into the adoption paradox narrative. If ETH usage metrics remain solid but open interest data show a heavy skew toward speculative longs or shorts, CryptoQuant may argue that much of the price action is being driven by leverage rather than by organic spot demand. In such a scenario, a sudden reversal in futures markets could overshadow any incremental improvement in on‑chain adoption, causing prices to overshoot fair value in either direction. For traders and investors, CryptoQuant’s derivatives analytics thus serve as an essential complement to its on‑chain and spot flow metrics.
Altcoin Spot Selling And Market Structure
Beyond Bitcoin and Ethereum, CryptoQuant analyzes altcoin flows, though coverage can be more fragmented due to the sheer number of networks and tokens. In recent commentary highlighted by news outlets, a CryptoQuant analyst reported that altcoin spot markets had experienced 15 consecutive months of net selling pressure, with the cumulative buy/sell volume difference reaching its most negative level in roughly five years. While specific figures were not provided in the search snippets, the key message was that altcoin holders had been steadily offloading positions on spot exchanges, contributing to a prolonged risk‑off environment in the long tail of crypto assets.
This pattern aligns with a broader narrative of capital rotation within crypto. During risk‑on phases, traders often move down the risk curve from Bitcoin into large‑cap altcoins and then into smaller, more speculative tokens, chasing higher returns. During risk‑off phases, the reverse tends to happen: capital flows out of high‑beta altcoins and back into Bitcoin, stablecoins, or fiat. CryptoQuant’s altcoin spot flow metrics provide evidence of such rotations by tracking whether spot exchanges see net inflows (potential selling) or net outflows (potential accumulation) of altcoins over time. Extended runs of net inflows coupled with weak prices suggest that altcoins are being sold into rallies or even into flat markets, consistent with a de‑risking regime.
Exchange‑level analyses add further nuance. CryptoQuant’s 2025 reporting, for instance, identified KuCoin as a leader in Bitcoin spot growth, indicating that this exchange had seen particularly strong growth in BTC spot trading volumes relative to peers. While the details of that report are outside the search results, this kind of ranking reflects the firm’s ability to slice data by exchange and asset, highlighting where different segments of the market are most active. Exchanges with a strong altcoin focus may show different flow patterns than those with a Bitcoin‑centric or institutional client base, and CryptoQuant’s metrics help traders identify where altcoin selling is most pronounced.
For altcoin investors, CryptoQuant’s findings serve as a reminder that on‑chain metrics and narratives about protocol adoption must be checked against hard data on spot flows and liquidity. A project may tout growing user numbers or total value locked, but if CryptoQuant’s exchange flow metrics show persistent net selling on major venues, the risk of prolonged price underperformance remains high. Conversely, a shift from net inflows to net outflows—indicating that more coins are leaving exchanges than entering—can be an early sign that long‑term holders are beginning to accumulate, potentially laying the groundwork for future recoveries.
Exchanges, Coinbase vs Binance, And Flow Dynamics
CryptoQuant’s granular address labeling allows it to attribute flows to specific exchanges, enabling analyses that differentiate between, say, Binance, Coinbase, and KuCoin. The firm’s tracking of Binance is particularly visible in public commentary: as noted, it was able to flag a net \$2.2 billion USDT inflow to Binance on a single day, identifying it as the largest one‑day stablecoin inflow since November 2025 and noting that it followed weeks of subdued capital movement. This level of specificity requires detailed knowledge of Binance’s deposit and withdrawal addresses and reflects CryptoQuant’s investment in mapping the exchange’s wallet infrastructure.
Different exchanges serve different customer bases and regulatory environments, and CryptoQuant’s exchange‑level data help tease out these distinctions. Binance, with its global retail and institutional clientele and wide suite of derivatives products, often acts as a bellwether of speculative activity. Coinbase, by contrast, operates as a U.S.-regulated exchange with a strong overlap with ETF issuers, institutional custodians, and retail investors who prefer regulated venues. By tracking flows to and from Coinbase’s on‑chain addresses, CryptoQuant and similar platforms can infer shifts in U.S.-domiciled demand, complementing ETF flow data that captures only a subset of institutional behavior.
KuCoin and other offshore exchanges, meanwhile, often cater to more altcoin‑oriented or high‑leverage traders. CryptoQuant’s identification of KuCoin as a leader in Bitcoin spot growth in 2025 suggests that some segments of the market have increasingly turned to such venues for BTC exposure, perhaps due to specific fee structures, product offerings, or regional access constraints. By comparing flows across Binance, Coinbase, KuCoin, and others, CryptoQuant’s analytics can reveal geographic and demographic rotations: for example, periods when U.S. demand (proxied by Coinbase and ETF flows) is soft while Asian demand (proxied by Binance and KuCoin flows) is strong, or vice versa.
It is important to note, however, that exchange flows are only part of the picture. The rise of custodial services, OTC desks, and direct ETF custody arrangements means that a growing share of large BTC transfers occurs between entities that may not be easily visible as “exchanges” in on‑chain data. Moreover, the increasing use of layer‑2 networks and cross‑chain bridges can complicate attribution, as funds may move off the base layer into environments where data is harder to consolidate. CryptoQuant’s exchange‑level metrics remain powerful tools, but they must be interpreted with an awareness of these evolving structural features.
CryptoQuant's own CEO publicly reversed a bear-cycle call, illustrating that even on-chain data aggregators can mistime macro turns when institutional flows dwarf historical patterns.
Strategy's 555,000 BTC concentration means CryptoQuant's 'deflationary' supply model is contingent on one corporate treasury not liquidating; any forced selling would violently invalidate the thesis.
Repeated CryptoQuant flags on perpetual futures open interest surges warn that derivatives-led rallies face cascading liquidation risk when momentum stalls.
CryptoQuant identified an 'adoption paradox' where Ethereum daily active addresses grow while price lags, projecting a potential decline to $1,500 if the bear market persists into Q3–Q4 2026.
CryptoQuant's revised bull thesis rests heavily on ETF inflows continuing; any regulatory reversal on spot ETF approvals or custody rules would invalidate the liquidity premise.
CryptoQuant derives metrics directly from full-node blockchain data and exchange-reported order books, giving its on-chain figures a verifiable, auditable foundation relative to survey-based competitors.
Using CryptoQuant In Trading And Investment Strategies
Short‑Term Trading And Tactical Positioning
For short‑term traders, CryptoQuant’s metrics offer a way to gauge whether a rally is being driven by robust spot demand or by leveraged speculation, and whether a selloff reflects organic long‑term de‑risking or a temporary liquidation cascade. Day traders and swing traders often monitor combinations of exchange inflows, open interest, funding rates, and realized profit metrics to inform their positioning. For example, a trader might note that Bitcoin open interest has surged alongside a sharp price increase and strongly positive funding rates, indicating that many traders are paying a premium to maintain leveraged long positions. If CryptoQuant’s data simultaneously show elevated realized profits and rising BTC inflows to exchanges, suggesting that profitable holders are sending coins to market, the trader might conclude that the risk of a sharp reversal is growing.
CryptoQuant’s commentary on bear markets and relief rallies provides further context for tactical decisions. When the firm’s technical analysis shows short‑term moving averages sloping downward and prices trading below medium‑term SMAs, its characterization of the environment as a bear market encourages caution about chasing strength. If rallies into resistance zones such as the 200‑day moving average are accompanied by spikes in realized profits, CryptoQuant’s “wall of resistance” framing underscores that such moves may be opportunities for selling or hedging rather than for aggressive buying. Traders who integrate these signals into their strategies might, for instance, tighten stop‑losses or reduce position sizes as price approaches the \$75,000–\$85,000 resistance band that CryptoQuant has highlighted, especially if derivatives positioning looks crowded.
Stablecoin flows add another layer to short‑term strategy. A sudden surge of USDT onto Binance, of the kind CryptoQuant flagged in March 2026, indicates that significant capital has moved to the sidelines of the trading arena and may soon be deployed. Aggressive traders might interpret this as a sign that volatility is likely to increase, prompting them to set wider stop‑loss ranges, adjust leverage, or prepare to fade over‑extended moves. However, since stablecoin inflows do not specify direction, prudent traders will look for confirmation in order‑book imbalances, spot volumes, and derivatives signals before committing to directional bets. CryptoQuant’s own guidance stresses that no single metric should be used in isolation, and the same principle applies to short‑term trading.
Ultimately, CryptoQuant’s data can be a powerful aid to tactical positioning, but it does not obviate the need for robust risk management. The firm’s insistence on describing levels such as \$53,600 realized price as “valuation bottom candidates” rather than guaranteed floors is a reminder that even historically reliable metrics can fail in new regimes. Traders using CryptoQuant data should therefore integrate it into a broader toolkit that includes technical chart analysis, order‑flow reading, and awareness of macroeconomic events, rather than treating it as a proprietary oracle.
Long‑Term Investing And Cycle Analysis
For long‑term investors, CryptoQuant’s greatest value lies in its ability to contextualize where the market stands in the broader cycle. Metrics such as realized price, demand contraction, supply distribution across holder cohorts, and extreme selling or buying pressure can help inform strategic decisions about when to accumulate, when to de‑risk, and how to think about long‑term expected returns. When CryptoQuant notes that Bitcoin’s realized price sits around a particular level, such as \$53,600, and that spot price has converged toward it after a long rally, long‑term investors may interpret this as a sign that valuations are returning toward a historical “fair value” band. If, at the same time, demand metrics show extreme contraction akin to 2019 and short‑term holders are realizing heavy losses, some investors may view that as a generational buying opportunity, albeit one that may require patience and tolerance for further volatility.
CryptoQuant’s commentary on supply dynamics also feeds into long‑term theses. Its founder, Ki Young Ju, has at times argued—outside the search snippets—that Bitcoin is effectively deflationary in float terms during periods when large institutional buyers, such as corporations or ETFs, are accumulating more BTC than miners are producing. In such phases, CryptoQuant’s data on miner reserves, ETF flows, and exchange balances can support the narrative that the available supply of Bitcoin is shrinking, potentially setting the stage for future price appreciation if demand recovers. Long‑term investors who buy into this narrative may be willing to accumulate during bear markets, treating price drawdowns as opportunities to acquire a scarce asset whose free float is gradually diminishing.
Ethereum’s adoption paradox also has implications for long‑term investors. CryptoQuant’s suggestion that ETH could fall toward \$1,500 despite strong network usage highlights the risk that even fundamentally robust assets can experience deep cyclical drawdowns. For investors who believe in Ethereum’s long‑term role as a smart‑contract platform, this may present an opportunity to accumulate at what they perceive as a discount relative to network value. But CryptoQuant’s emphasis on the severity of the disconnect between adoption and price is a reminder that fundamentals can remain “mispriced” for extended periods, particularly in markets influenced by leverage, regulatory uncertainty, and shifting narratives. For long‑term ETH holders, CryptoQuant’s data thus serve as both a warning and a guide, underscoring the need for time horizons and risk budgets that can withstand sustained volatility.
Altcoin investors can likewise use CryptoQuant’s metrics to think about cycle positioning. Extended periods of net spot selling, as indicated by the firm’s altcoin flow analyses, suggest that the market is in a structural de‑risking phase, where capital is rotating out of high‑beta tokens and into safer assets. Long‑term investors might choose to wait for signs of stabilization, such as a shift from net inflows to net outflows on major exchanges, before increasing exposure to such assets. In all cases, CryptoQuant’s long‑term value lies less in telling investors what to buy or sell and more in offering a framework for thinking about where the market might be in the boom‑bust continuum.
Institutional Use Cases And Risk Management
Institutions—ranging from hedge funds and proprietary trading firms to exchanges, custodians, and even traditional banks—use CryptoQuant’s data in ways that go beyond individual trading decisions. CryptoQuant’s institutional offering, described as an on‑chain market intelligence suite, is designed to slot into professional risk‑management systems, portfolio analytics, and compliance workflows. For a crypto‑focused hedge fund, for example, CryptoQuant’s APIs can feed into internal dashboards that monitor real‑time exchange inflows/outflows, derivatives open interest, and ETF flows, allowing risk managers to track systemic leverage, liquidity conditions, and potential sources of market stress.
Exchanges and custodians can use address‑level analytics both to monitor competitive dynamics—such as changes in market share, flows between venues, or shifts in regional activity—and to enhance their own risk controls. For instance, an exchange might monitor stablecoin inflows and BTC outflows at rival platforms to anticipate shifts in liquidity or to adjust fee incentives. Custodians might watch miner or whale reserves to evaluate the risk of large‑scale selling events that could impact collateral values. While CryptoQuant is not primarily a forensic tool, its high‑level metrics can inform decisions about capital allocation, hedging strategies, and product offerings.
For institutions interacting with ETFs and other regulated products, CryptoQuant’s data offer a bridge between traditional and crypto‑native metrics. ETF issuers and authorized participants can use on‑chain analytics to understand how ETF flows interact with overall BTC supply, miner behavior, and exchange reserves, informing their hedging, liquidity provision, and marketing strategies. Traditional banks and asset managers exploring crypto exposure can rely on CryptoQuant and peers like Glassnode to get a sense of structural features such as holder concentration, free float, and historical drawdown patterns, much as they would use fundamental research in equities or credit.
Finally, regulators and policy makers, while likely to rely more heavily on specialized chain‑analysis firms for compliance, may still draw on CryptoQuant’s macro‑level metrics to gauge systemic risks in the crypto ecosystem. Measures of leverage, concentration, and liquidity can inform debates about whether certain products or practices pose risks to financial stability. As crypto markets become more intertwined with traditional finance, the kind of data CryptoQuant provides is likely to become a routine input into institutional and regulatory decision‑making.
Bitcoin is now effectively deflationary, says CryptoQuant’s Ki Young Ju, as Strategy’s massive BTC purchases—555,000 BTC with no plans to sell—outpace new supply, creating a -2.23% annual deflation rate.
Strengths, Limitations, And How To Read CryptoQuant Critically
Strengths Of CryptoQuant’s Approach
CryptoQuant’s biggest strengths are its breadth of coverage, its integration of multiple data families, and its efforts to link metrics to actionable narratives. By combining on‑chain transaction data, spot exchange flows, derivatives positioning, stablecoin movements, and ETF flows, the firm offers a holistic view of the crypto market that goes well beyond simple price charts. For Bitcoin, this means that analysts can track everything from microtransaction counts and OP_RETURN usage to realized profits, demand contraction, and leverage, all from a single platform. For Ethereum and other assets, similar multi‑layered analyses are available, albeit with varying depth depending on network maturity.
Technically, CryptoQuant’s commitment to comprehensive transaction tracking and sophisticated address labeling is a key differentiator. Its documentation emphasizes that it keeps track of every transaction in the market and uses a combination of dusting and machine‑learning heuristics to label addresses, enabling metrics such as exchange inflows/outflows, miner reserves, and whale holdings. This infrastructure is capital‑intensive and requires constant maintenance, especially as new entities, wallets, and smart contracts enter the ecosystem. The payoff is an ability to detect large movements of coins between entities, to attribute flows to specific exchanges or cohorts, and to build derived metrics that would be impossible without detailed labeling.
Another strength lies in CryptoQuant’s willingness to tackle nuanced themes that do not fit simple bullish or bearish narratives. Its research on Bitcoin microtransactions and near‑record network activity, for example, highlights that on‑chain usage can rise even as price falls, challenging the assumption that adoption and price must move in lockstep. Its analysis of Ethereum’s adoption paradox similarly underscores that strong network fundamentals can coexist with weak price performance, forcing investors to think more carefully about how to value such assets. Its identification of extreme demand contractions, altcoin spot selling streaks, and large stablecoin inflows further illustrates a commitment to confronting uncomfortable data, rather than cherry‑picking bullish signals.
CryptoQuant also deserves credit for providing explanatory documentation and caveats. Its user guide on open interest clearly notes that high OI is primarily a volatility indicator and should be used with other metrics to identify tops and bottoms. Its head of research has explicitly warned against treating realized price estimates as guaranteed cycle bottoms, instead presenting them as tools for valuation and risk framing. And its “Why Trust CryptoQuant Metrics?” documentation explains how its address labeling system works and acknowledges that heuristics are subject to refinement over time. For users, these materials make it easier to understand not just what the metrics show, but how they are constructed and what their limitations are.
Limitations And Misinterpretation Risks
Despite these strengths, users must be aware of limitations and potential misinterpretation risks when relying on CryptoQuant’s data. On‑chain analytics, by definition, only capture activity that occurs on public blockchains; they do not see internal order‑matching within centralized exchanges, OTC trades that settle off‑chain, or derivatives exposures that are netted internally by institutions. While CryptoQuant’s address labeling helps map flows between known entities, many addresses remain unlabeled, and sophisticated actors can obscure their tracks using mixers, privacy tools, or complex routing patterns. Misclassification is also possible: a wallet could be incorrectly labeled as an exchange or as a personal wallet, affecting metrics that depend on those labels.
Derivatives metrics, meanwhile, depend on exchange‑reported data and are inherently ambiguous with respect to position direction. Open interest tells us how many positions are open, but not whether they are net long or net short. Funding rates and basis help, but can be influenced by idiosyncratic factors such as liquidity imbalances or hedging flows. Users who interpret rising OI as automatically bullish or bearish risk being misled if they do not consider complementary metrics. CryptoQuant’s own guidance cautions against such simplification, but in the noisy environment of social media and trading chat rooms, nuance is often lost.
Metrics like microtransaction counts and transaction volumes are also prone to misinterpretation. As CryptoQuant’s research on microtransactions and OP_RETURN usage suggests, a large share of Bitcoin’s recent transactions may be driven by inscriptions, technical operations, wallet consolidations, or other activities that are only loosely related to payments or investor adoption. Without understanding these underlying drivers, a casual observer might wrongly conclude that surging transaction counts imply surging demand for Bitcoin as money. CryptoQuant attempts to mitigate this risk by analyzing transaction size distributions and opcode usage, but users must still approach top‑line numbers with caution.
Valuation metrics such as realized price and demand contraction are based on historical patterns that may not hold in future regimes. While realized price has often aligned with cycle bottoms, there is no guarantee that it will always do so, especially if macro conditions or regulatory frameworks change dramatically. Similarly, demand contraction readings that match or exceed prior extremes may not necessarily mark the end of a drawdown; they could precede prolonged sideways markets or even further declines if structural demand is impaired. CryptoQuant acknowledges these uncertainties by framing its conclusions in probabilistic terms, but users may be tempted to treat them as more precise than they are.
Finally, as with any research‑driven business in a competitive space, there is always a risk that bold narratives receive disproportionate attention. CryptoQuant’s analyses are often summarized by media outlets in eye‑catching headlines—“Bitcoin bear market has started,” “Ethereum could fall to \$1,500,” “Bitcoin rally faces resistance at \$85,000”—which may not fully convey the conditional nature of the underlying arguments. Readers should therefore distinguish between the data and the narrative, ideally consulting the original charts and research notes to understand the assumptions and caveats involved.
Comparing CryptoQuant With Other Providers
CryptoQuant operates in a competitive landscape alongside other analytics platforms such as Glassnode, IntoTheBlock, and Santiment. Glassnode, for example, describes itself as a provider of digital asset market intelligence and on‑chain data for finance professionals and institutions, emphasizing a similar commitment to trusted data and analytics. Both CryptoQuant and Glassnode focus heavily on Bitcoin and Ethereum, offer dashboards and APIs, and publish research notes that interpret their metrics in a macro‑market context. The existence of multiple providers is a strength for the ecosystem, as it allows users to cross‑check metrics and to compare methodologies.
At a high level, CryptoQuant and its peers can be contrasted along several dimensions, including focus areas, typical users, and notable public metrics. The following table provides a simplified comparison between CryptoQuant and Glassnode, based on publicly available descriptions:
| Feature | CryptoQuant | Glassnode |
|---|---|---|
| Primary focus | On‑chain and market data with emphasis on exchange flows, derivatives, and ETFs | On‑chain data with emphasis on holder behavior and structural metrics |
| Key assets | Bitcoin, Ethereum, major altcoins, stablecoins | Bitcoin, Ethereum, major altcoins |
| Target users | Institutions, professional traders, research desks | Finance professionals, institutional investors |
| Signature public themes | Demand contraction, microtransactions, ETF flows, altcoin spot selling | HODL waves, realized cap, coin maturation, long‑term holder behavior |
| Research style | Mix of Quicktakes and deeper research tied to short‑term events and cycles | Longer‑form research and weekly on‑chain reports |
This table is necessarily approximate and does not capture the full range of each provider’s offerings, but it illustrates that CryptoQuant leans somewhat more toward exchange flows, derivatives, and ETF‑related analyses, while Glassnode has historically emphasized structural on‑chain metrics such as HODL waves and long‑term holder supply. In practice, serious traders and institutions often use multiple providers, both to gain access to proprietary metrics and to ensure that any conclusions drawn from one dataset are not artifacts of a particular methodology.
For readers, comparing CryptoQuant with its peers reinforces an important point: on‑chain and market analytics are tools, not oracles. Different providers may measure similar concepts in slightly different ways, leading to small discrepancies in reported numbers or even in qualitative conclusions. Rather than treating any one vendor as gospel, it is more productive to understand the concepts underlying the metrics—such as realized price, open interest, exchange inflows, and microtransaction counts—and to consider how multiple independent estimates align.
Outlook
CryptoQuant is likely to remain a central voice in crypto market analysis as digital assets continue their long transition from speculative niche to integrated component of the global financial system. Its focus on Bitcoin and Ethereum, its expansion into ETF and stablecoin flow analytics, and its willingness to grapple with complex themes such as microtransaction‑driven network activity and Ethereum’s adoption paradox position it well to interpret the next phases of crypto’s evolution. As layer‑2 networks, cross‑chain bridges, and new asset types (such as tokenized real‑world assets) grow in importance, the firm will face the challenge of extending its data pipelines and address‑labeling techniques into more fragmented and heterogeneous environments. How it navigates that challenge will shape the usefulness of its metrics in a future where not all relevant activity occurs on a single base‑layer blockchain.
At the same time, the broader environment in which CryptoQuant operates is becoming more demanding. Institutional investors and regulators now expect data quality, transparency, and robustness comparable to that of traditional financial markets, while competition from other analytics providers continues to intensify. To maintain credibility, CryptoQuant will need to keep refining its methodologies, expanding documentation, and clearly communicating the limitations and uncertainties associated with its metrics. Its existing practices—such as publishing user guides that explain concepts like open interest, and research notes that explicitly describe valuation levels as “candidates” rather than certainties—suggest that it is aware of these responsibilities.
For a crypto news audience, the practical takeaway is that references to CryptoQuant in headlines and analysis pieces are unlikely to diminish; if anything, they will grow more frequent as on‑chain and market data become standard ingredients in market commentary. Readers who understand how CryptoQuant’s metrics are built, what they can and cannot tell us, and how they fit into broader narratives about Bitcoin bear markets, Ethereum valuation, and altcoin cycles will be better positioned to interpret those stories critically. Whether Bitcoin is described as hitting “bear‑market resistance” near \$80,000, Ethereum is said to be flirting with an “adoption paradox,” or altcoins are reported to be under “five‑year extreme” selling pressure, the underlying data will often trace back to CryptoQuant or similar platforms. Approached with informed skepticism and a clear understanding of their construction, these metrics can significantly enrich the conversation about where crypto markets have been, where they stand, and where they might be heading next.
Latest CryptoQuant news
CryptoQuant reports Bitcoin spot trading volume hit an October peak as renewed market participation lifted exchange activity, signaling improving spot conditions and reduced volatility risks.BTC momentum, the worst on record per CryptoQuant.Bitcoin is now effectively deflationary, says CryptoQuant’s Ki Young Ju, as Strategy’s massive BTC purchases—555,000 BTC with no plans to sell—outpace new supply, creating a -2.23% annual deflation rate.CryptoQuant CEO Ki Young Ju admits he was wrong about the bull cycle ending, pointing to how much new liquidity is coming from institutions and ETFsBitcoin and Ethereum futures open interest drops by $1.37B, signaling a leverage washout and partial market reset, potentially curbing speculation, says CryptoQuant analyst Alex Adler.Sources
- https://cryptoquant.com
- https://cryptoquant.com/insights/research
- https://x.com/WuBlockchain/status/2064903016881574029
- https://phemex.com/news/article/cryptoquant-warns-ethereum-price-may-drop-to-1500-amid-adoption-paradox-66168
- https://cryptoquant.com/insights/quicktake/693d6196b9c81572b3898eb9-Bear-Market-Has-Started-According-to-Bitcoin-and-Ethereum-Technical-Analysis
- https://www.facebook.com/CoinMarketCap/posts/bitcoin-hits-126k-but-profit-taking-stays-low-rally-may-continue-cryptoquant-rev/1217418157082242/
- https://cryptoquant.com/asset/eth/chart/derivatives/open-interest
- https://cryptoquant.com/insights/quicktake/69ba1a128d720a25909cb34e-Binance-recorded-a-22-billion-USDT-inflow-the-largest-single-day-stablecoin-depo
- https://www.binance.com/ar/square/post/25972619440297
- https://bitcoinfoundation.org/news/bitcoin/bitcoin-demand-down/
- https://cryptoquant.com/institutions
- https://userguide.cryptoquant.com/cryptoquant-metrics/market/open-interest
- https://glassnode.com
- https://userguide.cryptoquant.com/what-is-cryptoquant/introduction/why-trust-cryptoquant-metrics
- https://cryptoquant.com/insights/research/6a049a5174e3a32a7dd4cafd-13-May-2026-Wall-of-Resistance-Bitcoin-Tests-the-200-Day-MA-as-Profit-Taking-and
- https://cryptoquant.com/insights/research/6a340f769139404af2b01f8f-18-June-2026-The-Surge-Near-Record-Bitcoin-Micro-Transaction-Counts-Drive-Network
- https://coinstats.app/news/a31480c86ac1e6364c07a1dcf4f6eb12bb901029d3e863c91443131a7e36f3eb_CryptoQuant-says-bitcoin-rally-could-face-resistance-between-75000-and-85000
Community notes
Spot something off or out of date? Drop a note. Editors review topic notes daily and roll accepted fixes into the explainer — contributors are recognized in the monthly $SQUID drop.
Loading notes…