
Explains how accumulation works in crypto across BTC, ETH and altcoins, covering whale wallets, corporate treasuries like Strategy and BitMine, on‑chain metrics, risks of leveraged hoarding, and why shrinking liquid supply can shape future market cycles.
+6 sources across the wider coverage universe
 Metaplanet raises $50M via zero-interest bonds to double down on Bitcoin accumulation, reinforcing corporate treasury shift toward BTC reserves2026-04
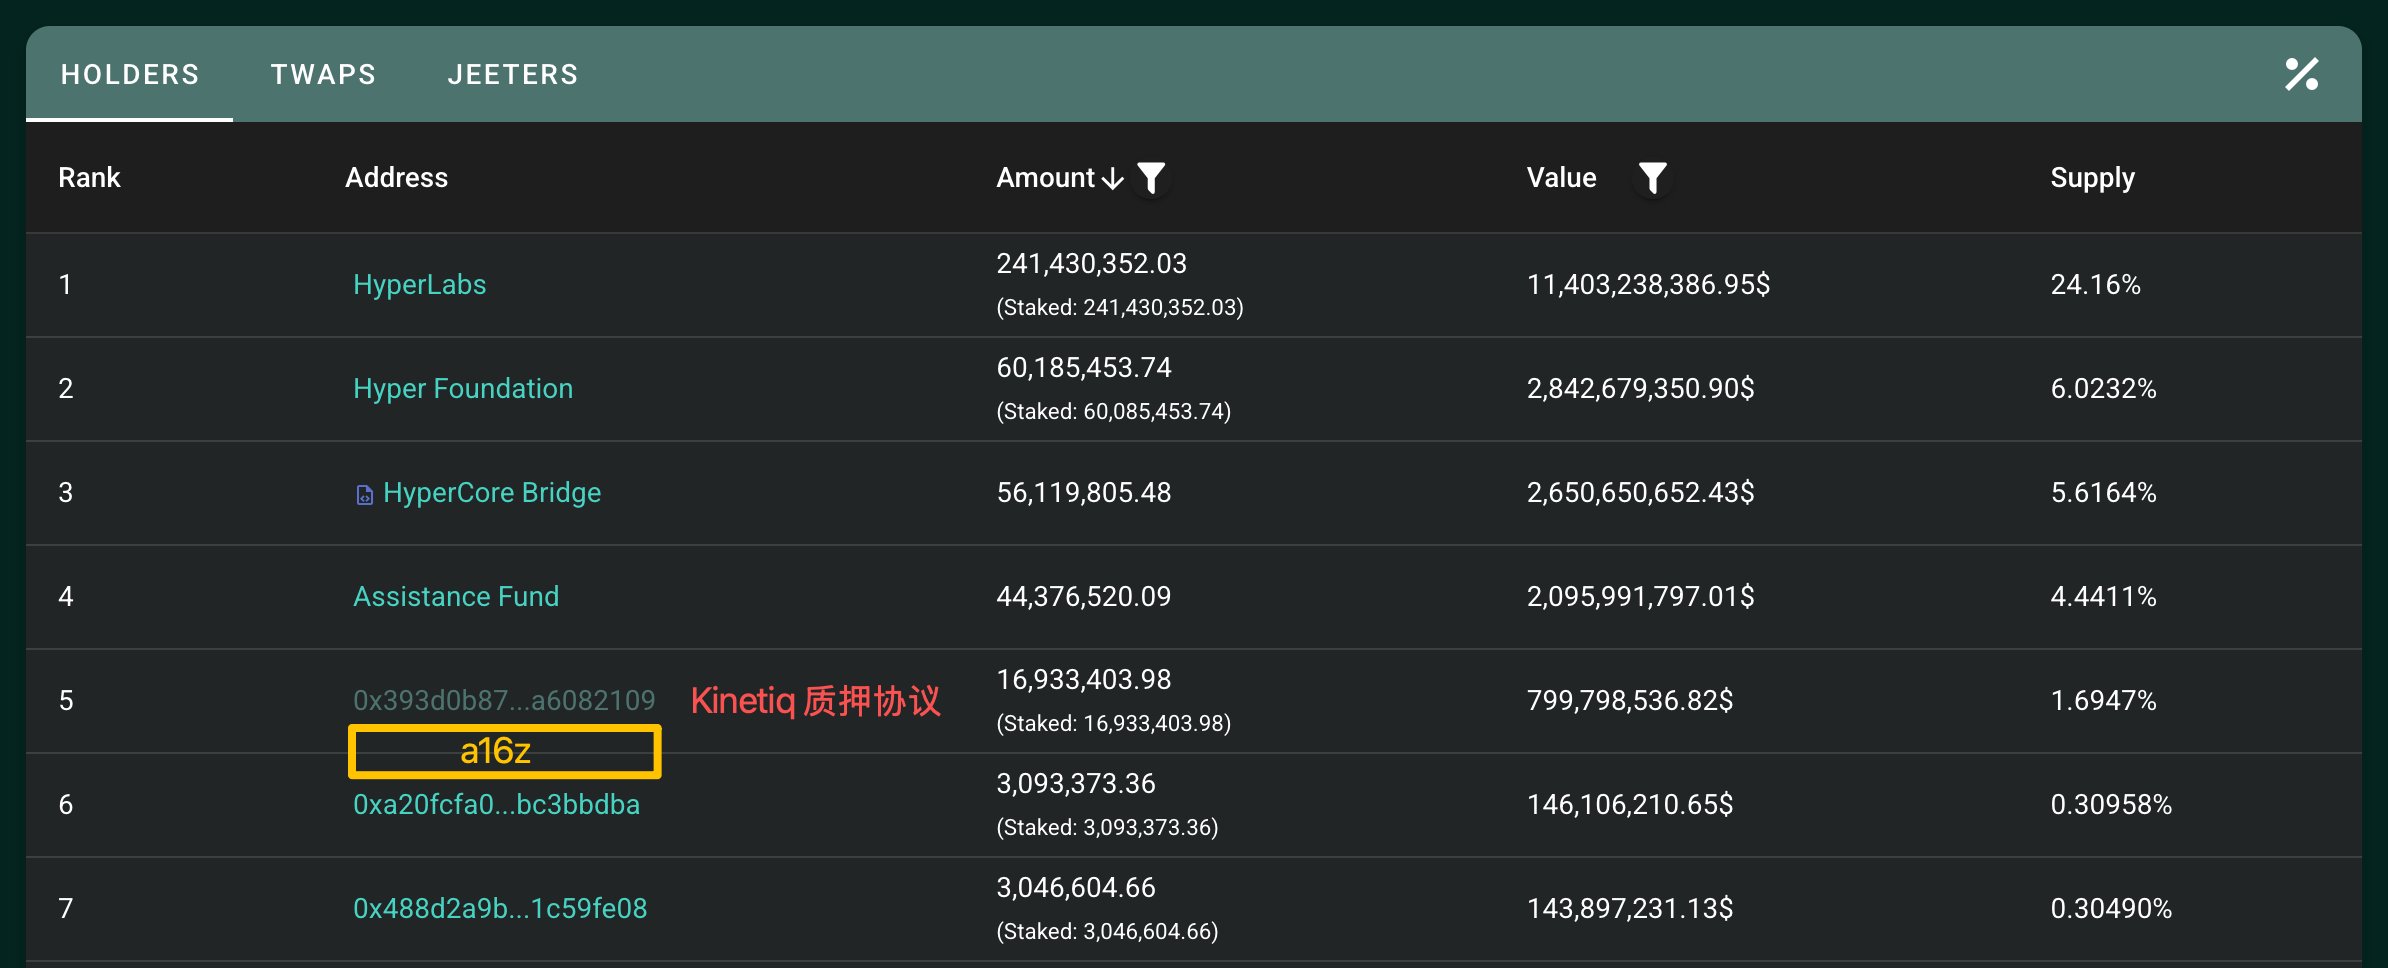 a16z-linked wallets appear to rank sixth among HYPE holders after $356M accumulation since August 20252026-05
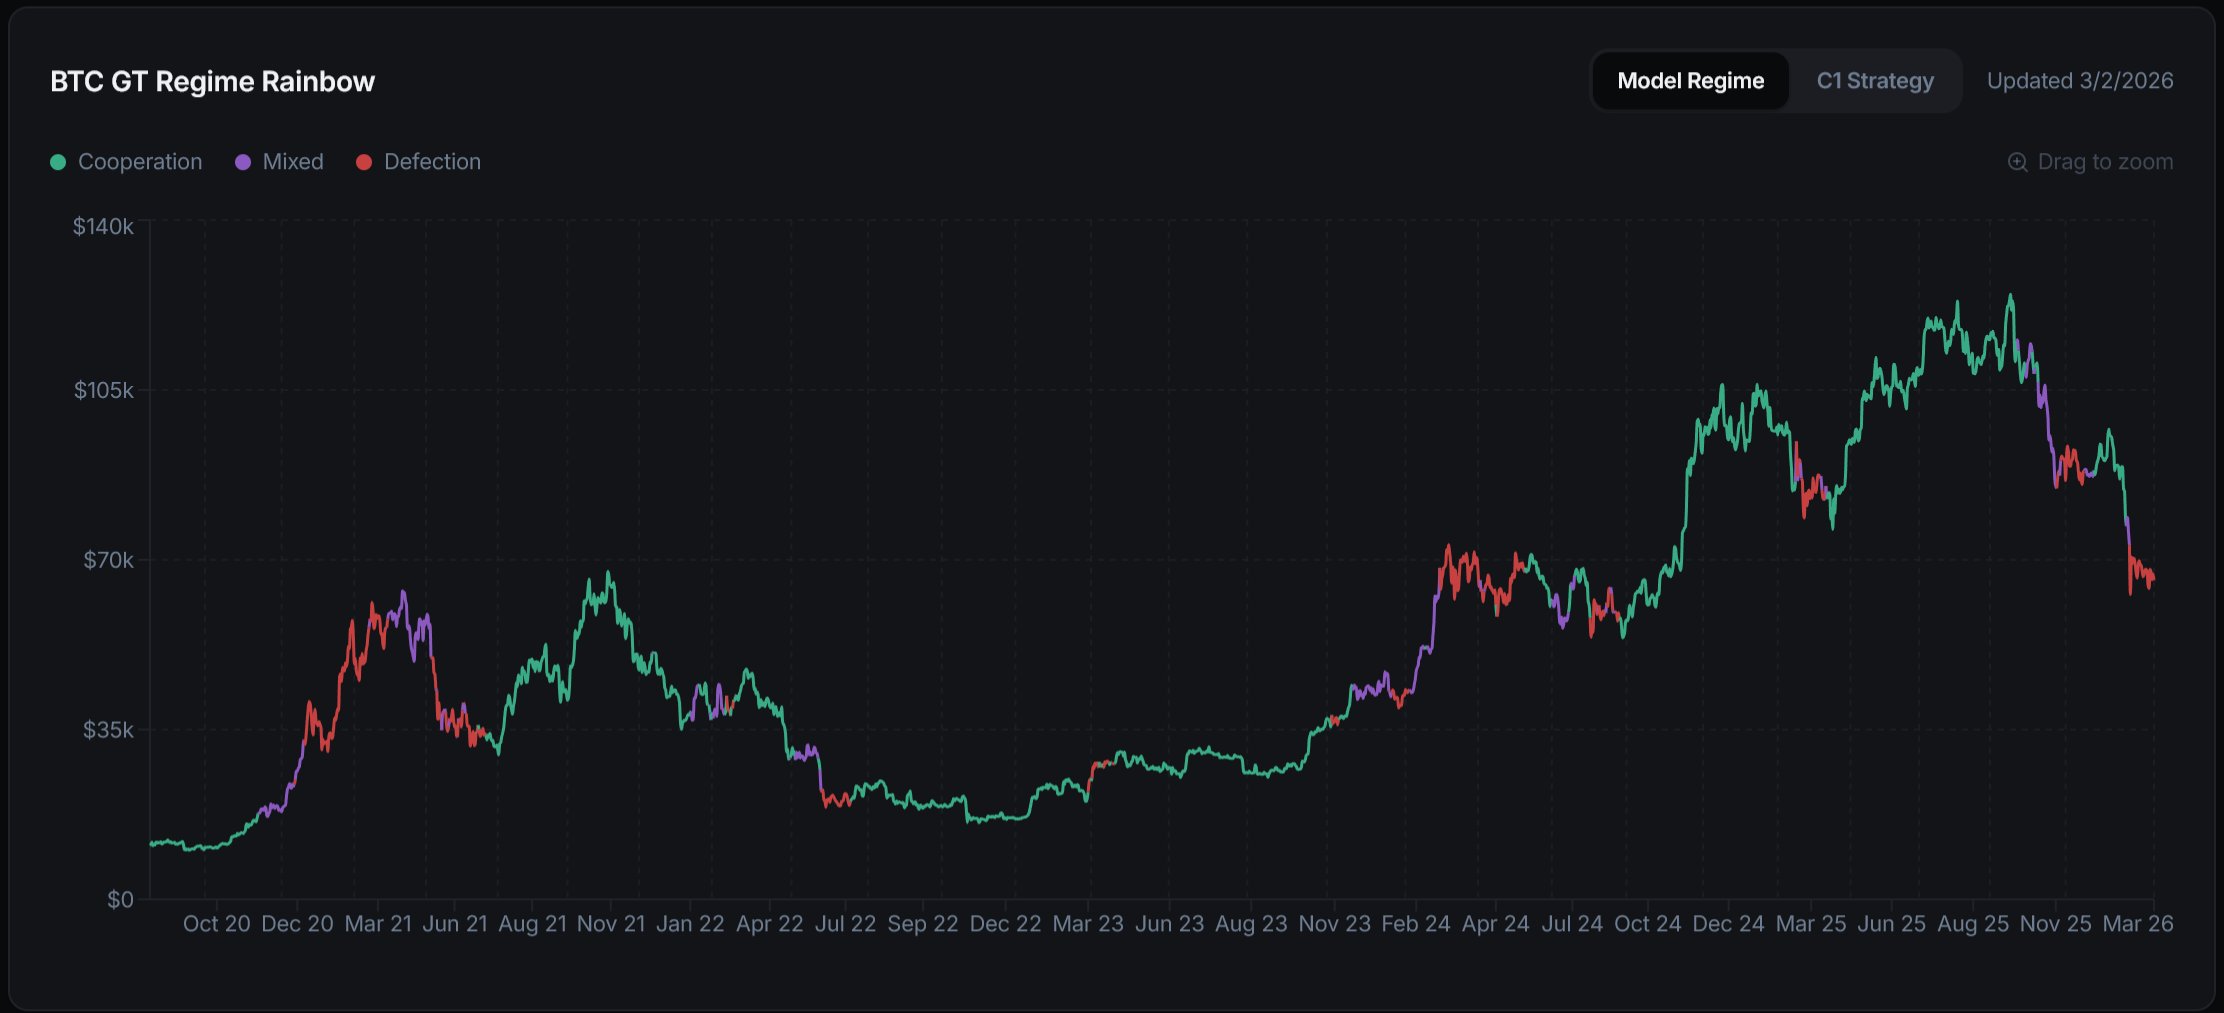 The Game Theory Rainbow Chart tracks when Bitcoin shifts from coordinated accumulation to self-interested defection regimes2026-03
 STRC 8-K shows 16,816 BTC bought last week via 11.8M new shares worth $1.18B at ~$70k per BTC, lifting Bitcoin treasury accumulation to record, accelerating pace versus prior weeks.2026-03
 Bitmine drops $147M on ETH in largest weekly buy of 2026, extends accumulation streak to five weeks2026-03
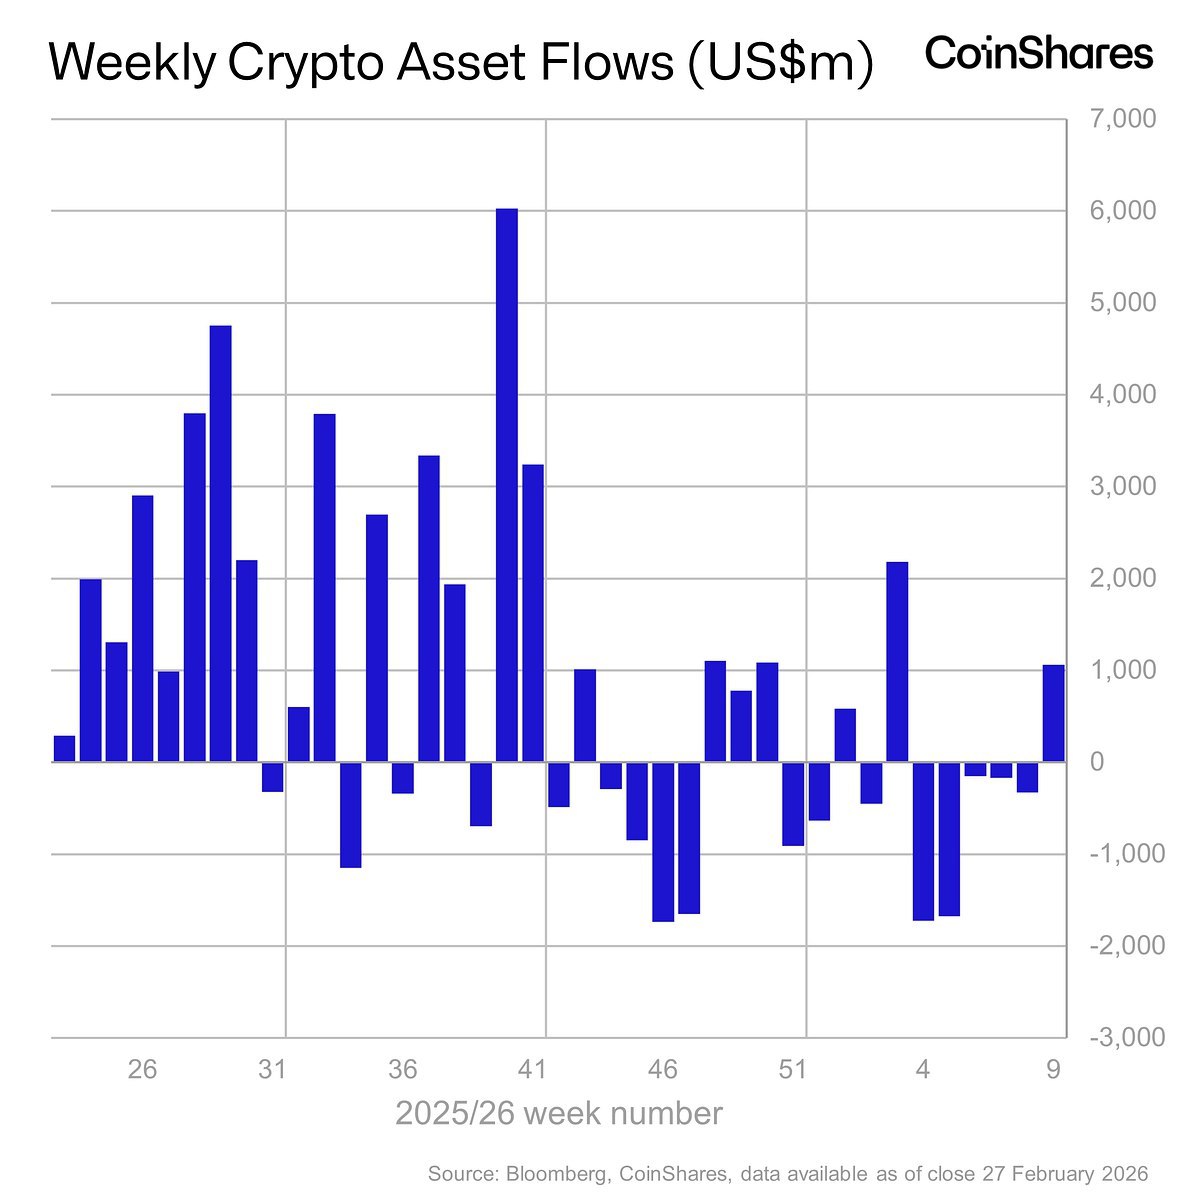 Whale accumulation drives $1B inflows into digital asset funds after five-week outflow streak2026-03
Accumulation in Crypto: How Long‑Term Buying Shapes Bitcoin, Ethereum, and the Wider Market
In digital asset markets, accumulation refers to sustained, often deliberate net buying of a cryptocurrency over time, usually during periods of price weakness or sideways consolidation. It is the opposite of distribution, and it underpins everything from long‑term Bitcoin holding and ETH treasury strategies to whale wallets quietly building positions in emerging tokens.
What Is Accumulation in Crypto?
In the broadest sense, accumulation is the process of increasing one’s holdings of an asset over time. In crypto, that can mean a retail investor dollar‑cost averaging into BTC each payday, a whale wallet withdrawing tens of thousands of ETH from exchanges, or a listed company issuing bonds to fund a Bitcoin reserve. What unifies these actions is the intent to build exposure steadily, rather than to trade in and out based on short‑term price moves. Because crypto markets trade around the clock and on‑chain movements are publicly visible, accumulation leaves distinctive footprints in both price charts and blockchain data.
Technical analysts often use the term in a more specific way, rooted in the Wyckoff market cycle model. In that framework, an accumulation phase is a period after a downtrend where strong‑handed buyers absorb supply from weaker holders, usually within a broad sideways range. In crypto, such phases are characterized by price oscillating within a band, failed breakouts in both directions, and elevated volume as positions change hands. During these ranges the prevailing narrative is often ambiguous or bearish, yet under the surface, capital shifts from impatient speculators to long‑term holders.
Data providers now formalize this idea. Sites that track “accumulation phase” coins typically look for assets with unusually high volumes relative to price volatility, indicating active two‑sided trade within a band rather than a trending market. They may also look at on‑chain metrics such as the percentage of supply held by long‑term wallets, or the rate at which coins leave exchanges, to infer whether a token is in an accumulation zone. Because crypto trades globally and 24/7, these zones can persist for months as new buyers gradually absorb available float.
It is useful to distinguish between accumulation as a behavior and accumulation as a market phase. A single whale wallet building a position is an example of the former; whether that is sufficient to define a market‑wide accumulation phase depends on broader flows. Conversely, an accumulation phase on a chart can occur even if many small holders are selling, so long as a subset of larger or more patient buyers are willing to absorb that supply. On‑chain tools allow analysts to identify both patterns: they can label cohorts by wallet size or holding time, and track whether those cohorts are net buyers or sellers.
Finally, accumulation always has a counterpart: distribution. Every coin accumulated was sold by someone else. On‑chain realized profit and loss data frequently shows that large spikes in realized losses coincide with heavy accumulation by stronger hands, as recent buyers capitulate into more patient holders. This dynamic is central to how many investors interpret washout events, drawdowns, and periods of extreme fear. However, it also underscores a key point: accumulation does not guarantee future gains. Rather, it reshapes who holds the asset and at what cost basis, which in turn influences how that asset may trade when conditions change.

a16z-linked wallet withdraws 25,000+ ETH ($42.6M) from Binance, a move typically associated with long-term accumulation.
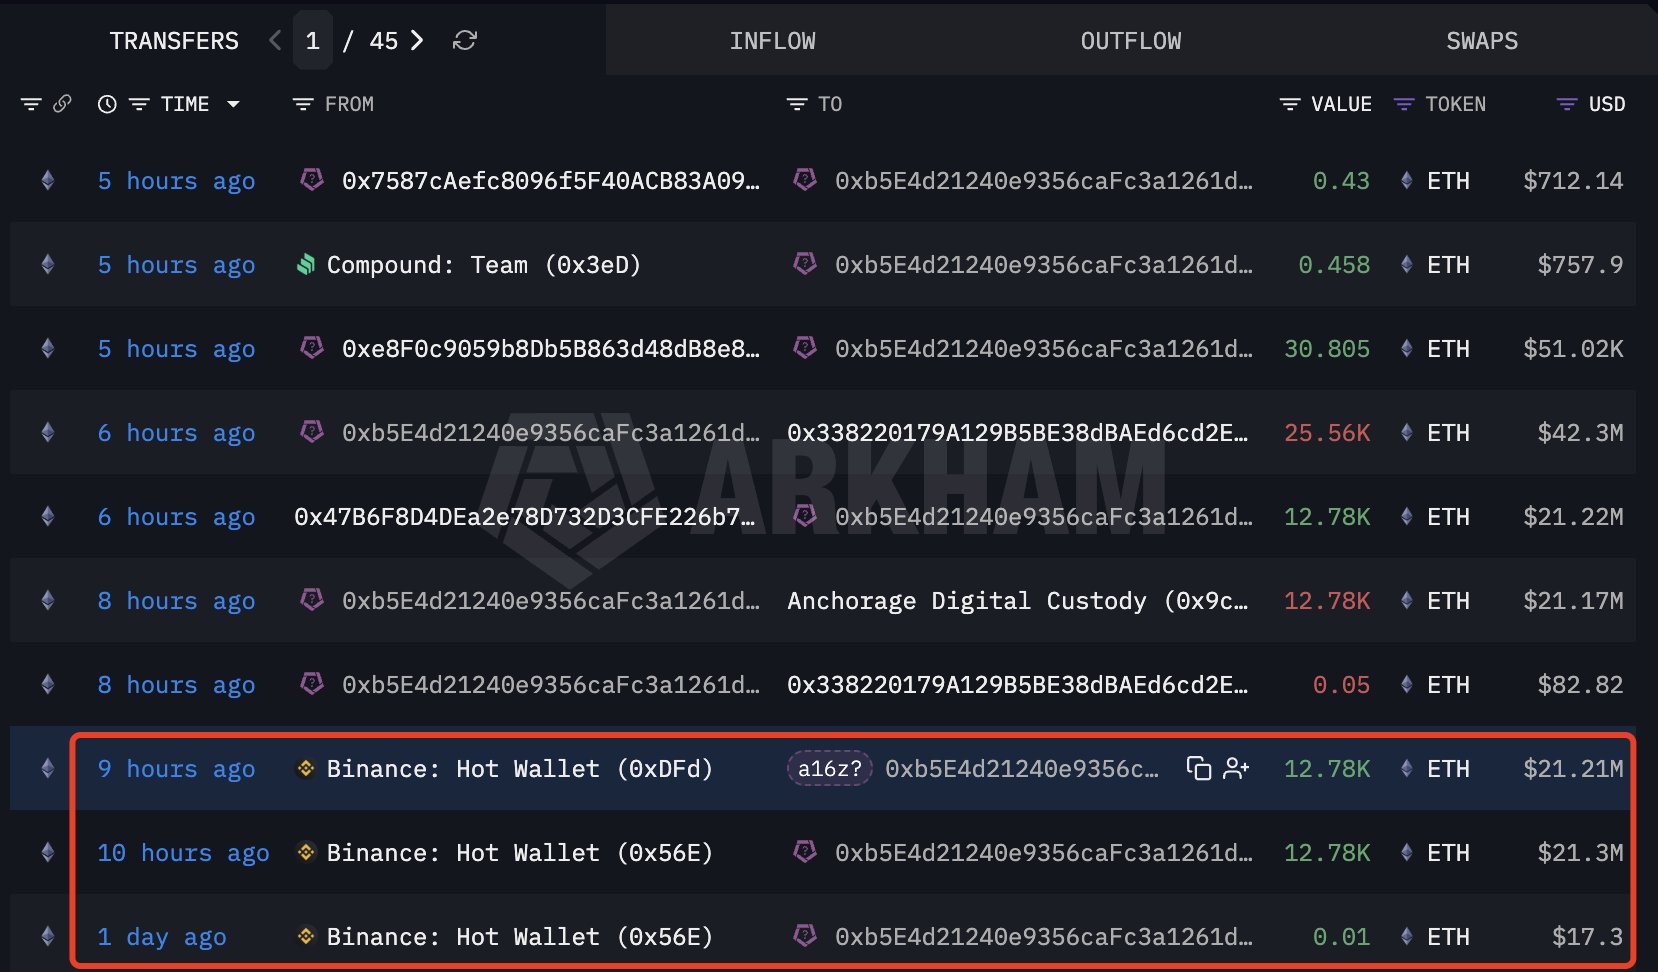

25,560 ETH is the hard datapoint; the a16z tag is still an Arkham/Lookonchain attribution, so I’d watch the next hop before treating it as a clean fund-level bid. If it lands in cold storage or validator flow, that’s float removal; if it routes into Lido, EigenLayer, Aave, or Morpho, it becomes productive collateral and can push ETH beta through DeFi credit rails. CT is already split between “conviction size” and “exit liquidity,” which is exactly how ETH looks when institutions accumulate while spot still chops.
Readers click accumulation stories almost exclusively when they can answer 'who specifically' — a named whale wallet, a publicly-filed 8-K, or a VC address on-chain — revealing that the actual buy thesis is irrelevant without forensic actor attribution.↗
Why Accumulation Matters for Crypto Market Structure
Accumulation is particularly consequential in crypto because the leading assets have constrained or transparent supply dynamics. Bitcoin’s issuance schedule is hard‑coded, and Ethereum’s net supply is governed by a combination of issuance and fee burning. When a large fraction of circulating coins migrate into long‑term wallets, the effective float available to trade shrinks, potentially amplifying the impact of new demand. This is why analysts pay close attention to exchange reserves and hoarding behavior.
Recent data illustrates this clearly for Bitcoin. Reserves on major centralized exchanges dropped to their lowest level since 2023 after roughly 100,000 BTC, equivalent to around 8 billion dollars at then‑current prices, flowed out over a short period. Such outflows are commonly interpreted as a signal that holders are moving coins into self‑custody or long‑term storage, often as part of an accumulation process. In practical terms, fewer coins on exchanges means less immediately sellable supply, which can make spot markets more sensitive to incremental buying pressure.
The distribution of holdings also matters. On‑chain analysis shows that addresses holding more than 10,000 BTC—often treated as “whales”—have periodically entered clear accumulation phases after major drawdowns. By March 2025, this cohort controlled roughly 2.26 million BTC, and analysts noted that renewed whale accumulation has historically tended to precede major bull markets as supply in the hands of short‑term speculators dwindles. At the same time, it is notable that the number of such very large whale addresses has fallen since the 2022 bear market, suggesting some consolidation of holdings among a smaller set of very large players.
Market participation intensity offers another angle. Bitcoin active addresses fell to an eight‑year low as speculative excitement cooled, which on‑chain observers interpreted as a sign that the market had transitioned from high‑churn trading to a more subdued environment dominated by long‑term accumulation. In these quieter phases, new coins often move from exchanges into wallets that thereafter display low spending activity, consistent with a “buy and hold” strategy. The combination of low speculative activity, depressed prices, and increasing long‑term holdings is a classic backdrop for accumulation.
Corporate and institutional behavior magnifies these trends. Public companies such as Metaplanet have raised capital specifically to add Bitcoin to their treasuries, for example issuing 50 million dollars in zero‑coupon bonds to fund additional purchases and grow their holdings to more than 40,000 BTC. Digital asset treasury managers and specialist firms continue to pursue multi‑year accumulation strategies through both bull and bear markets, even as they navigate drawdowns and volatility. These moves signal a structural shift in how some corporations treat BTC and, increasingly, ETH—as balance‑sheet assets akin to strategic reserves rather than merely trading instruments.
Ethereum exhibits similar dynamics with some important twists. Its transition to proof‑of‑stake and the introduction of fee burning have created conditions under which net ETH supply can contract, especially during high on‑chain activity. Long‑term holder data indicates that entities with holding periods measured in years have built positions through past downturns, with one dataset showing ETH long‑term holders controlling a record 26.3 million coins going into a renewed price uptrend. Because these coins are often staked or otherwise locked, their accumulation can constrain available liquidity more severely than simple cold storage.
Tokenomics adds another layer. Some projects explicitly design supply‑reduction mechanisms that complement accumulation. For example, the JST ecosystem burned approximately 1.356 billion JST, roughly 13.7% of total supply, in a phased process described as moving from accumulation to execution to finality, with all steps recorded on‑chain. Here, early accumulation by protocols or treasuries is followed by deliberate supply contraction, changing the calculus for later buyers. In such systems, accumulation interacts with buybacks, burns, and protocol revenue in ways that are distinct from Bitcoin’s fixed‑supply model.
Forms of Accumulation Strategies
Individual Investors and Dollar‑Cost Averaging
For many individual investors, accumulation takes the form of dollar‑cost averaging (DCA): buying a fixed amount of BTC or ETH at regular intervals regardless of price. The idea is to reduce timing risk by spreading purchases across market cycles. Mexican billionaire Ricardo Salinas offers a high‑profile example of this mentality, describing his personal strategy succinctly as converting fiat into Bitcoin as soon as he receives it. In interviews, he has framed this as a long‑term savings plan, recommending that ordinary savers buy small quantities of BTC consistently and hold for five to ten years rather than attempting to trade short‑term swings.
DCA‑style accumulation has intuitive appeal in a market as volatile as crypto. Rather than waiting for a “perfect” entry, the investor accepts that they will sometimes buy at local highs and sometimes at local lows, but that over time their average cost basis should reflect a fair value across cycles. The historical tendency of BTC and ETH to post higher highs across cycles, despite deep interim drawdowns, underpins the perceived logic of this strategy. It also aligns with the behavioral reality that most people cannot reliably time tops and bottoms, whereas they can automate recurring purchases.
However, DCA is not without trade‑offs. It assumes a long time horizon and a strong thesis that the asset will be worth more in the future; if that thesis fails, DCA simply accumulates losses. It also implicitly commits the investor to continue buying through bear markets, when sentiment is most negative and confidence hardest to maintain. Salinas’s suggestion that people treat Bitcoin accumulation as a form of savings underscores the psychological framing needed to stick with such a plan. For many, automating purchases and using cold storage wallets to minimize daily attention helps maintain discipline.
Another subtle aspect is that small‑scale DCA by millions of users can collectively become a structural force. Recurring purchases through exchanges and apps create a baseline of constant demand that offsets miner selling and some portion of trader distribution. While any individual DCA buyer has negligible market impact, the aggregate flows can contribute to a slow‑grinding accumulation floor, especially when large institutional buyers are inactive. Over time, this can support price stability even during periods of low speculative interest.
Whale Wallets and Strategic Position Building
At the other end of the spectrum are whale wallets: addresses holding very large quantities of a token. In Bitcoin, on‑chain researchers often define whales as wallets with more than 10,000 BTC. Data suggests that after the 2022 bear market, the number of such wallets shrank from 121 to 88, yet their aggregate holdings rose to around 2.26 million BTC by early 2025, reflecting a period of aggressive accumulation by a smaller but more capital‑rich set of players. This kind of concentration can materially affect liquidity and market dynamics.
Whale accumulation is not limited to Bitcoin. In the Ethereum ecosystem, a wallet associated with market maker Cumberland withdrew 26,500 ETH—nearly 60 million dollars—from major exchanges including OKX, Binance, Bybit, and Coinbase over a twelve‑hour period, a textbook example of strategic accumulation facilitated through centralized venues. Such large, rapid withdrawals reduce immediately sellable supply and signal that the entity intends to hold or deploy the assets off‑exchange, at least in the near term. Market makers and funds often spread purchases across venues to avoid signaling too much intent at once, but on‑chain trackers can sometimes reconstruct these patterns from withdrawal activity.
Venture‑linked wallets also participate in accumulation, particularly in newer tokens. Analysts estimate that a cluster of wallets associated with a16z accumulated approximately 9.18 million HYPE tokens, valued at around 356 million dollars, since August 2025. These wallets reportedly added 4.92 million HYPE just in 2026, with an estimated average purchase price of about 38.77 dollars, making them the sixth‑largest holder cohort and possibly the largest external holder outside the project’s own ecosystem addresses. In this case, accumulation expresses a venture‑style conviction bet on a specific protocol rather than a broad crypto‑beta play.
Whale strategies carry unique risks and opportunities. On one hand, whales who accumulate during depressed markets can become de facto backstops, providing bid support and reducing downside volatility. On the other hand, their eventual distribution can exert heavy selling pressure if they choose to realize profits into a thin market. Traders often monitor whale wallets with a mixture of fascination and caution, recognizing that trying to front‑run or mimic whale behavior without their information advantages can be dangerous. Nonetheless, sustained whale accumulation in a major asset is widely interpreted as a bullish structural signal, especially when corroborated by declining exchange balances and rising long‑term holder metrics.
Corporate Treasuries, Funds, and Leveraged Accumulation
An increasingly important source of accumulation comes from corporate treasuries and listed vehicles that treat BTC or ETH as strategic assets. The most prominent example in Bitcoin has been Strategy, a publicly traded firm that has financed massive BTC purchases through a mix of equity, debt, and a variable‑rate preferred equity instrument known as STRC. For years, Strategy followed a strict buy‑and‑hold approach, accumulating hundreds of thousands of BTC without selling. This one‑way strategy turned the company into a leveraged proxy for Bitcoin, with its stock trading heavily on BTC’s trajectory.
Recently, however, Strategy’s model has come under scrutiny. Grayscale’s head of research, Zach Pandl, noted that STRC was designed to trade at 100 dollars per share and pay an 11.5% dividend, but it slipped to around 95 dollars, signaling that investors were demanding a higher yield than the instrument provided. If Strategy raises that dividend to restore STRC to par, its cash obligations rise, potentially forcing additional Bitcoin sales to fund payouts. The firm’s sale of just 32 BTC—minuscule relative to its 843,706 BTC stockpile—was enough to shake investor confidence, triggering broader selling and a 16% drop in Bitcoin’s price. Pandl argued that this episode highlighted the risks of concentrated, leveraged accumulation, and that dispersing BTC holdings across a more diversified set of corporate holders could ultimately strengthen the ecosystem.
Not all corporate accumulation is leveraged. Metaplanet’s use of zero‑coupon bonds to finance Bitcoin purchases illustrates a different model, where fixed‑income investors effectively fund BTC accumulation in exchange for a future cash return rather than immediate yield. Meanwhile, a growing roster of digital asset treasury firms and publicly listed miners have announced multi‑year strategies to build BTC and ETH reserves, often continuing to buy through bear markets despite mark‑to‑market losses. Analyst upgrades, such as banks raising their price targets for Strategy when it accelerates Bitcoin purchases and deleverages in accretive ways, show how traditional equity markets are beginning to price accumulation strategies as core to company value.
Ethereum has its own corporate accumulator in BitMine Immersion Technologies, which has executed a series of large ETH purchases. In early 2026, BitMine extended its buying streak to a fifth consecutive week, recording its largest weekly accumulation since December 2025 and spending about 147 million dollars on ETH in a single week. That brought its total ETH holdings to roughly 4.875 million as of mid‑April, cementing its status as one of the largest corporate ETH treasuries. BitMine’s chairman has publicly framed ETH as “the future of money” in long‑form interviews, arguing that the company’s accumulation is a strategic bet on Ethereum’s role as financial infrastructure. At the same time, BitMine has signaled periods of moderation, slowing its Ethereum purchases as prices rally to manage concentration and market impact.
Protocol‑Level Accumulation, Buybacks, and Burns
Beyond wallets and corporate treasuries, accumulation can occur at the protocol level through buybacks, treasury programs, or on‑chain systems that absorb and retire tokens. In the JST ecosystem, for instance, the team has described a three‑phase process in which the supply moves from initial accumulation to execution and finally to “finality,” marked by aggressive burning of tokens. To date, the protocol has permanently removed roughly 1.356 billion JST from circulation—about 13.7% of the total supply—equivalent to over 60 million dollars in value at the time of reporting, with all operations recorded transparently on‑chain. Here, early accumulation by the protocol and its stakeholders sets the stage for later burn events that reshape token economics.
Protocol‑driven buybacks are not unique to JST. Our newsroom has covered projects like OGN, where fee‑funded buybacks reportedly boosted accumulation by thirty‑fold, demonstrating how protocol revenues can be recycled into token support. However, such strategies raise regulatory and market‑structure questions, including whether aggressive buybacks might be construed as market manipulation or create expectations that the protocol will always defend certain price levels. Unlike Bitcoin, where accumulation is entirely opt‑in at the holder level, these systems embed accumulation logic into the protocol or governance process itself.
Exchanges and platforms can also act as accumulators. Coverage of Upbit’s coin accumulation strategy around certain stablecoins has highlighted how platforms may add tokens like USD‑pegged assets incrementally, balancing limited listings and high volatility risks with the desire to meet user demand. In such cases, accumulation serves dual purposes: managing inventory for market‑making and custody, and expressing a view on which assets will be core to the platform’s future business. These actors operate under different constraints than individual traders, including regulatory capital requirements and risk limits, but their steady purchases or holdings can nonetheless influence float.
Together, individual DCA buyers, whales, corporate treasuries, and protocols form a layered accumulation landscape. Each has different motivations and risk tolerances, yet their behaviors intersect in price discovery. For example, a protocol burning supply while whales accumulate and retail DCA continues can create a powerful tailwind, whereas concentrated corporate hoarding financed with leverage may amplify both upside and downside volatility. Understanding who is accumulating, how, and with what funding structure is therefore critical to interpreting crypto market moves.
- 01Named-whale ETH on-chain attribution
A $260M Voorhees-linked ETH position drew 5× more clicks than any other story, showing readers want named actors, not anonymous 'whale' abstractions.
- 02STRC preferred-share funding loop↗
Multiple high-click headlines traced exactly how Strategy's STRC preferred-stock ATM machine converts equity issuance into BTC at scale — readers tracked the mechanics, not just the headline number.
- 03ETH treasury firm race (BitMine/Bitmine)↗
The Ethereum Foundation's OTC sale to BitMine and Bitmine's own $147M weekly buy landed together, framing a narrative of a new class of ETH treasury competitors modeled after Strategy.
- 04Bitcoin regime-shift game theory signals
The Game Theory Rainbow Chart story attracted strong clicks by framing accumulation not as a price call but as a detection problem — identifying when coordinated buying collapses into defection.
- 05VC wallet on-chain tracking (a16z/HYPE)↗
Two separate a16z-linked wallet stories combined for 64 clicks, showing readers treat large fund addresses as public signals worth monitoring in real time.
- 06Institutional inflow reversal signals
The $1B fund inflow story after a five-week outflow streak was read as a regime confirmation, not just a data point — readers wanted the streak-break framing.
Measuring Accumulation: On‑Chain Metrics and Market Data
Exchange Balances, Flows, and Self‑Custody
One of the most straightforward ways to infer accumulation is to track the balance of coins on centralized exchanges. Data platforms such as CryptoQuant aggregate wallet balances across major trading venues and present time series of exchange reserves, flows, and other on‑chain indicators for BTC and other assets. A sustained decline in exchange balances suggests that coins are being withdrawn to self‑custody or long‑term storage, which is generally associated with accumulation, whereas rising balances can indicate that holders are preparing to sell or trade.
For Bitcoin, a notable drop in exchange reserves occurred when roughly 100,000 BTC—about 8 billion dollars worth—left centralized trading platforms over a short interval, pushing reserves to their lowest level since 2023. Analysts widely interpreted this as evidence of a major accumulation wave, with investors choosing to hold coins off‑exchange rather than keep them available for immediate sale. Combined with other data, such as rising long‑term holder balances and high conviction metrics, this pattern suggested that a critical mass of participants had shifted into a “HODL” mindset.
However, interpreting exchange flows requires nuance. Not all withdrawals signify long‑term accumulation; some may move coins to OTC desks, DeFi protocols, or custodians for trading in other venues. Conversely, not all deposits signal selling, as some long‑term holders periodically reshuffle coins or collateralize them for loans. Still, when withdrawal surges line up with other indicators—such as a decline in active addresses and an uptick in long‑term holding metrics—they provide strong circumstantial evidence of accumulation.
Whale Ratios and Cohort Behavior
More granular insight comes from metrics that break down flows by wallet size and transaction concentration. CryptoQuant’s Exchange Whale Ratio, for instance, measures the proportion of exchange inflows represented by the ten largest transactions. A high ratio means that a small number of large players dominate inflows, which can signal that whales are sending coins to exchanges, potentially to sell. Conversely, a lower ratio during periods of declining exchange balances may indicate that whales are not the primary sellers, and may in fact be accumulating.
Analysts also monitor balance changes across cohorts such as shrimp (small holders), fish, sharks, and whales, often defined by thresholds like 1–10 BTC, 10–1,000 BTC, or more than 1,000 BTC. Glassnode’s Accumulation Trend Score is one such metric, designed to capture the relative intensity of accumulation across these cohorts. When the score approaches 1, represented as dark blue on its charts, it indicates that large and influential entities are adding more BTC to their balances than they are distributing; values near 0 suggest net distribution. During a recent Bitcoin drawdown to around 80,000 dollars, Glassnode data showed the Accumulation Trend Score spiking toward 1, indicating a broad shift from distribution to accumulation across almost all holder cohorts.
Another metric, focusing on conviction buyers, tracks coins held in wallets that historically display low spending behavior. Bitfinex reported that such conviction buyers now hold nearly 4 million BTC, an increase of roughly 300% since the end of 2025, marking the largest two‑quarter surge in accumulation since the COVID‑era crash. This suggests not just opportunistic buying, but a structural migration of coins into hands that have previously demonstrated a willingness to hold through volatility. When combined with shrinking exchange supplies and active accumulation by mid‑sized holders, this paints a picture of tightening liquid supply.
Realized Losses, Capitulation, and Accumulation Windows
Realized profit and loss data adds an emotional and behavioral dimension. When prices fall sharply, on‑chain metrics often register large realized losses, as coins previously acquired at higher prices move on‑chain and crystallize the loss. In a recent downturn, Bitcoin’s aggregate realized losses reached approximately 5.78 billion dollars as prices fell toward 80,000 dollars, with short‑term holders (STHs) accounting for around 3 billion and long‑term holders (LTHs) approximately 1.78 billion. Analysts interpreted this as a classic capitulation event, where newer entrants sold at a loss while more experienced holders absorbed some of the selling.
Historically, such spikes in realized losses have often coincided with the start of accumulation phases. The logic is that capitulation flushes out weak hands, allowing long‑term investors to buy at discounted prices. Binance research highlighted that during one such episode, whales and mid‑sized holders switched from distribution to accumulation, with whales and sharks collectively absorbing nearly 240% of the newly mined BTC supply. This means these cohorts were buying more than twice the number of coins produced by miners, a powerful sign of demand exceeding organic issuance.
However, realized loss spikes can also accompany de‑risking by large holders. At times, reports have noted that Bitcoin accumulation trends weakened as realized losses surged past 600 million dollars, with whales shifting to distribution and prices sliding toward 76,000 dollars. This underscores that not every loss spike marks the beginning of a healthy accumulation phase; sometimes it reflects stress across the holder base, including larger actors. Analysts therefore cross‑reference realized P&L with cohort balances, exchange flows, and derivatives positioning to discern whether losses are being absorbed by stronger hands or signaling broader fragility.
Price, Volume, and the Texture of Accumulation Phases
Even without on‑chain data, price and volume patterns can hint at accumulation. As noted earlier, accumulation phases often appear as extended trading ranges with relatively high volumes. Price repeatedly tests support and resistance without initiating sustained breakouts, and both bullish and bearish attempts to break the range tend to fail. DropsTab, which tracks coins in accumulation zones, emphasizes that during such phases trading volumes are significantly higher than usual while price fluctuates within a band, with frequent failed breaks in both directions. These patterns can be amplified by trading bots and algorithmic strategies, making it difficult to parse signal from noise.
This range‑bound behavior reflects a tug‑of‑war between sellers motivated by fear, liquidity needs, or lack of conviction, and buyers willing to absorb that supply at perceived fair value. Over time, if buyers remain persistent and the rate of new supply (from mining or token unlocks) is manageable, the balance tips toward accumulation. Eventually, the market runs short of willing sellers at the lower end of the range, setting the stage for an upside breakout. Conversely, if buyers lack staying power, the range can resolve downward, showing that what looked like accumulation was in fact redistribution among short‑term traders.
In practice, analysts blend these perspectives. They might note that Bitcoin is trading sideways with failed breakdowns, that exchange balances are trending lower, that Glassnode’s accumulation trend score is high, and that conviction buyers’ holdings are increasing. Together, these signals provide a multi‑faceted view of accumulation that is richer than any single metric. But they also require humility, as crypto markets have repeatedly demonstrated that apparent accumulation can morph into distribution as macro conditions, regulation, or sentiment shift.
Bitcoin Accumulation in Focus
Bitcoin remains the primary lens through which the market thinks about accumulation, both because of its size and because of its fixed issuance schedule. Historically, BTC has cycled through periods of rapid price appreciation, euphoric speculation, sharp drawdowns, and extended consolidation. Accumulation tends to occur during and after these consolidations, when narratives are fractured and attention has shifted elsewhere. These are the moments when whales, corporates, and conviction retail investors quietly build positions.
On‑chain data indicates that cycles of whale accumulation have often preceded major bull markets. After the 2022 bear market bottom, the number of addresses holding more than 10,000 BTC fell, but those remaining embarked on a steady accumulation path, reaching around 2.26 million BTC by March 2025. At the same time, previously dormant long‑term holders began to re‑enter profit as prices recovered, reducing their immediate incentive to sell. Combined with declining exchange balances and low active address counts, this suggested that significant amounts of supply had migrated into stronger hands.
The recent surge in conviction buyers adds another chapter to this story. Bitfinex data shows that wallets characterized by low historical spending—i.e., addresses that tend not to sell—now hold nearly 4 million BTC, a roughly threefold increase since late 2025. This is the largest two‑quarter accumulation spike since the COVID crash in 2020, when macro fear drove prices down and long‑term believers stepped in. Such growth in conviction holdings reinforces the idea that, while trading flows ebb and flow, a structural base of holders is willing to absorb volatility and build positions over multi‑year horizons.
Corporate treasuries act as both amplifiers and potential shock absorbers. Strategy’s leveraged approach, financed via instruments like STRC, transformed the firm into a kind of quasi‑ETF for Bitcoin, but it also introduced feedback loops. When STRC traded below its intended 100‑dollar par and investors demanded higher yields, the pressure on Strategy’s cash flows increased. Pandl’s analysis highlighted that higher dividend obligations might force the company to sell BTC, and even a symbolic sale of 32 BTC was enough to unsettle the market, contributing to a 16% slide in BTC’s price. In essence, a leveraged accumulator became a potential source of forced distribution under stress.
Other corporates have pursued less levered strategies. Metaplanet’s use of zero‑coupon bonds is one example of matching long‑dated liabilities with a long‑term BTC accumulation thesis. Miners that retain part of their block rewards, asset managers that build BTC reserves, and listed companies that dollar‑cost average with free cash flow all contribute to a more diversified accumulation base. Grayscale’s Pandl has argued that spreading BTC across a broader set of corporate holders, rather than concentrating it in highly leveraged vehicles, would ultimately reduce systemic risk and improve market resilience.
Accumulation is not a one‑way street, though. During sharp corrections, reports have highlighted episodes where Bitcoin accumulation trends weakened as realized losses surged to figures like 600 million dollars, with whales shifting from accumulation to distribution and prices sliding toward the mid‑70,000s. In such moments, some large holders lock in gains or de‑risk, even as new buyers step in. The net effect determines whether the episode proves to be a brief shakeout in a longer accumulation trend or the start of a more protracted distribution phase.
One intriguing recent signal is the decline in active addresses to an eight‑year low, which some analysts interpret as evidence that speculative trading has waned and that the market may be in a long‑term accumulation regime. Combined with low exchange balances and robust long‑term holder metrics, this suggests that BTC is increasingly concentrated among entities with low spending propensity. Yet, as the Strategy episode shows, concentration and leverage can also amplify volatility when those entities face external pressures. The ongoing interplay between conviction buyers, leveraged treasuries, whales, and retail DCA will likely remain central to Bitcoin’s market narrative.
Strategy launches STRC preferred stock as primary BTC accumulation vehicle
a16z-linked wallets begin $356M HYPE accumulation, eventually reaching rank 6 among holders
Strategy's largest single-week BTC buy: 22,337 BTC for $1.18B via STRC (week of March 9–15)
- 2026-03milestone
Strategy total holdings reach 762,099 BTC (~$57.69B), average cost ~$75,694
Metaplanet raises $50M via zero-coupon bonds to accelerate Bitcoin treasury accumulation
- 2026-03governance
Ethereum Foundation sells 5,000 ETH to BitMine in $10M OTC deal, signaling shift in ETH treasury ecosystem
Bitmine posts $147M ETH weekly buy — largest ETH corporate accumulation event of 2026
- 2026-06milestone
Voorhees-linked whale publicly charts $260M ETH accumulation position, triggering record reader engagement
Ethereum and Layer‑1 Accumulation
Ethereum’s accumulation dynamics differ from Bitcoin’s in important ways. Unlike BTC, which functions primarily as a store‑of‑value narrative asset with limited on‑chain programmability, ETH is the native asset of a vast smart‑contract ecosystem. It is used for gas fees, staking, DeFi collateral, and NFT trading. These additional use cases create multiple reasons to accumulate ETH beyond simple price speculation, including access to yield, governance, and participation in on‑chain economies.
On‑chain data indicates that long‑term ETH holders have steadily increased their balances through previous downturns. One report noted that the total ETH held by long‑term entities reached a record 26.3 million as prices began to recover from a local low near 1,940 dollars and rallied roughly 20% to 2,330 dollars. This suggested that, even as shorter‑term traders capitulated during the drawdown, patient investors were quietly adding to their positions or at least refraining from selling. The presence of these long‑term holders can smooth volatility and provide a base of demand for new supply, especially as staking rewards entice holders to lock up coins.
Technical analysis of ETH’s price action has also pointed to accumulation‑style patterns. On the 12‑hour chart, ETH formed a rounded bottom, with price retesting support around 2,140 dollars where the support line and 20‑day exponential moving average converged. Analysts argued that a successful breakout above the 2,400‑dollar neckline of this pattern could open the way to a measured target near 2,940 dollars, roughly 32% above the then‑current price. While chart patterns are not proofs of accumulation, they often coincide with periods when smart money builds positions under the surface as retail focus lags.
Whale and corporate behavior further reinforces the Ethereum accumulation narrative. BitMine Immersion Technologies has become a major ETH accumulator, extending a buying streak into a fifth consecutive week with a 147‑million‑dollar purchase that marked its largest weekly buy since December 2025. This brought its holdings to approximately 4.875 million ETH by mid‑April, and additional coverage has highlighted subsequent large weekly buys—on the order of more than 100,000 ETH and hundreds of millions of dollars—that push the firm closer to owning 5% of ETH’s supply. These flows represent a structural vote of confidence in Ethereum’s long‑term role as a financial settlement layer.
Whale wallets outside the corporate realm are active as well. The Cumberland‑linked wallet that withdrew 26,500 ETH, worth about 59.5 million dollars, from multiple exchanges in a 12‑hour window demonstrates the scale and speed at which sophisticated actors can accumulate. Because Cumberland is a well‑known market maker, such activity may reflect client flows, internal inventory management, or proprietary positioning. Regardless, concentrated withdrawals of this magnitude reduce available liquidity on exchanges and signal that large players see value in holding ETH at current levels.
Altcoin accumulation also deserves mention. The a16z‑linked cluster of wallets accumulating HYPE to a total of 9.18 million tokens, with 4.92 million added in 2026, is a classic example of venture‑driven accumulation in a newer asset. At an estimated average price of 38.77 dollars, this represents a long‑term, high‑conviction bet on HYPE’s ecosystem and Hyperliquid’s infrastructure. Because these holdings reportedly make the wallets the sixth‑largest overall and the biggest external holder, they dramatically shape liquidity, governance, and price discovery. In such environments, other investors must weigh whether they are comfortable with this degree of concentration.
Overall, accumulation in Ethereum and other layer‑1s intertwines with usage and tokenomics more directly than in Bitcoin. Staking, fee burns, and protocol revenues influence net supply; whales and corporates seeking both yield and exposure accumulate in ways that can lock up liquidity; and venture and protocol treasuries shape early distribution. This makes interpreting accumulation more complex but also more nuanced, as it reflects not just pure financial speculation but also strategic alignment with specific ecosystems.
Risks, Misinterpretations, and Ethical Questions
While accumulation is often framed as a bullish signal, it is important to approach it with a critical lens. One common misconception is to treat any observed accumulation as a guarantee of future price appreciation. In reality, accumulation simply describes a pattern of net buying; it does not specify who is buying, what their funding model looks like, or how they may behave under stress. Strategy’s leveraged accumulation model, for instance, was celebrated while BTC rallied, yet became a source of systematic risk once STRC traded below par and dividend obligations threatened to force Bitcoin sales. The same accumulation that boosted bull‑market upside also amplified volatility on the way down.
Another risk lies in over‑interpreting on‑chain signals. Not all whale withdrawals represent accumulation; some may be moving coins to OTC desks, custodians, or cross‑chain bridges. Address clustering heuristics can misidentify entities, causing analysts to attribute behavior to the wrong actors. Metrics like the Exchange Whale Ratio offer valuable context but must be combined with other data to avoid false narratives. Similarly, a spike in realized losses could indicate capitulation being absorbed by strong hands, or it could reflect broad deleveraging across all cohorts, including long‑term holders. Without careful cross‑analysis, it is easy to mistake noise for signal.
Accumulation can also obscure liquidity risks. When coins concentrate in a small number of whale wallets or corporate treasuries, the market becomes more vulnerable to sudden shifts in those entities’ behavior. A corporate treasurer changing strategy, a regulatory action forcing balance‑sheet restructuring, or a large whale deciding to diversify can release substantial supply into markets that are unprepared to absorb it. Pandl’s argument that spreading Bitcoin holdings across a more diversified set of corporate holders would be healthier for the ecosystem speaks directly to this concern. Concentrated accumulation is a double‑edged sword.
Protocol‑level accumulation and buybacks raise regulatory and ethical questions. When a project like JST burns a significant fraction of its supply as part of a pre‑announced, on‑chain system, or when OGN channels fees into aggressive token buybacks, it blurs the line between decentralized token economics and traditional corporate stock support. Regulators may ask whether such actions constitute attempts to manipulate price or create expectations of a “put” that encourages speculative risk‑taking. Meanwhile, smaller holders must evaluate whether they are comfortable depending on teams or protocols to manage token supply in their interests.
Information asymmetry is another challenge. Whales, corporates, and funds often have better access to market data, OTC liquidity, and risk management tools than retail investors. When analysts spotlight a16z‑linked HYPE accumulation or Cumberland’s large ETH withdrawals, they are revealing only part of the picture; the motivations, hedging strategies, and exit plans behind those moves often remain opaque. Retail traders who blindly follow whale wallets without understanding this context can end up providing exit liquidity rather than sharing in long‑term gains.
Finally, there is the question of fairness and market integrity. Some argue that monitoring and publicizing whale accumulation on social media incentivizes copy‑trading and herd behavior, potentially exacerbating volatility. Others counter that blockchain transparency is a feature, not a bug, and that more information leads to better price discovery. Either way, responsible coverage and analysis of accumulation should avoid turning complex, multi‑dimensional behavior into simple buy or sell signals. Evergreen explainers like this one aim to give readers a framework rather than a ticker tape of whale moves.
Strategy's annualized STRC dividend obligations have risen to ~$300M+; weakening preferred-share prices directly increase the cost of BTC accumulation and create reflexive downside pressure.
Large OTC and ATM-funded purchases at concentrated price points (e.g., ~$70K/BTC for STRC tranches) create visible cost-basis anchors that the market trades against.
Strategy alone holds 738K–762K BTC (~3.5% of supply), and coordinated corporate treasury accumulation concentrates on-chain supply in a handful of auditable addresses.
Issuing preferred stock (STRC) and zero-coupon bonds (Metaplanet) expressly to purchase digital assets draws heightened SEC and international regulator scrutiny on the instrument-to-asset funding chain.
- Liquidity / ATM-dependencyMedium
Accumulation pace for STRC-funded buyers hard-stops when the preferred share trades below par, as seen when STRC needed its longest post-dividend recovery before ATM sales could restart.
Named-wallet attribution (Voorhees, a16z) creates front-running risk once addresses are public, but the positions disclosed are large enough that exit liquidity constraints offset this for the accumulators themselves.
Conclusion
Accumulation is one of the most important, and least understood, dynamics in crypto markets. It spans a spectrum of behaviors, from individuals quietly dollar‑cost averaging into BTC and ETH, to whale wallets withdrawing tens of thousands of coins from exchanges, to corporates like Strategy, Metaplanet, and BitMine reshaping their balance sheets around digital assets. It also operates at multiple layers of the stack: at the wallet level through self‑custody, at the protocol level through buybacks and burns, and at the market‑structure level through exchange reserves and derivatives positioning.
The key insight is that accumulation is about who holds the asset, on what terms, and with what time horizon, not merely about price. When coins move from short‑term speculators to long‑term holders, the effective float shrinks, potentially increasing sensitivity to new demand. When leveraged entities dominate accumulation, the system becomes more fragile, as funding conditions and dividend obligations can force distribution at inopportune times. When protocol treasuries or venture funds become mega‑holders in new tokens, they shape governance and liquidity in ways that persist for years.
For a crypto news audience, the practical takeaway is not to treat accumulation as a simple bullish headline, but as an evolving puzzle. Exchange outflows, whale ratios, accumulation trend scores, realized P&L spikes, and corporate treasury announcements each illuminate a piece of the picture. Understanding how these pieces fit together—and where they might break apart under stress—is what separates narrative from analysis. As BTC, ETH, and other assets continue to mature, the stories we tell about accumulation will increasingly center not just on how much is being bought, but on what that says about the future shape of the crypto economy.
Outlook
Looking ahead, accumulation is likely to remain a central lens for interpreting crypto’s long‑term trajectory. On the Bitcoin side, the combination of shrinking exchange reserves, growing conviction holdings, and continued interest from corporate treasuries suggests that the proportion of BTC held as long‑term strategic reserves will keep rising, even if short‑term volatility persists. Episodes like Strategy’s STRC‑linked turbulence may push markets toward less leveraged forms of accumulation, with more diversified corporate and institutional holders distributing risk across the system.
In Ethereum and other programmable chains, accumulation will increasingly intertwine with usage. Staking, protocol revenue sharing, and fee‑burn mechanics incentivize long‑term holding and can reduce net supply, especially as more assets and activities migrate on‑chain. At the same time, large corporate accumulators like BitMine, venture whales like a16z in HYPE, and protocol‑level burn systems like JST will continue to raise questions about concentration, governance, and regulatory treatment. How these tensions are resolved—through design changes, regulation, or market discipline—will shape the next chapter of crypto’s evolution.
For investors, builders, and policymakers, the enduring challenge is to distinguish healthy, sustainable accumulation from fragile, over‑levered hoarding. That requires looking beyond price charts to the underlying flows of coins, capital, and information. As long as blockchains remain transparent and global, the patterns of accumulation they reveal will continue to offer a unique window into where conviction, risk, and opportunity are truly concentrated.
Latest Accumulation news
Sources
- https://dropstab.com/accumulation-phase
- https://cryptoquant.com/asset/btc/summary
- https://cryptoquant.com/asset/btc/chart/flow-indicator/exchange-whale-ratio
- https://www.tradingview.com/news/cointelegraph:8f8a5fb45094b:0-bitcoin-exchange-reserves-fall-to-two-year-low-after-8b-exodus/
- https://cryptorank.io/news/feed/18cce-bitcoin-whales-accumulation-phase-analysis
- https://x.com/Cointelegraph/status/2041783011943849997
- https://www.binance.com/en/square/post/33306271063777
- https://x.com/bitfinex/status/2054457022452555802
- https://www.youtube.com/watch?v=5gMMbAl_z6U
- https://x.com/crowdfundinside/status/2064486520351035775
- https://www.tradingview.com/news/newsbtc:fc4bf716b094b:0-strategy-s-leveraged-bitcoin-model-is-under-strain-researchers-warn/
- https://www.advfn.com/stock-market/COIN/BTCUSD/crypto-news/98587212/bitcoin-accumulation-trends-weaken-as-realized-los
- https://crypto.news/hype-whale-alert-a16z-linked-wallets-may-rank-no-6/
- https://x.com/DeFi_JUST/status/2054475735432110524
- https://www.youtube.com/watch?v=BB_mGRr5bBQ
- https://www.facebook.com/CoinMarketCap/posts/latest-metaplanet-has-raised-50-million-through-zero-coupon-bonds-to-buy-more-bi/1380633514094038/
- https://www.mexc.com/news/1024729
- https://phemex.com/news/article/whale-accumulates-26500-eth-worth-5952-million-72221
- https://bitmarkets.com/insights/article/bitmine-buys-147-million-of-ether-in-biggest-weekly-buy
Community notes
Spot something off or out of date? Drop a note. Editors review topic notes daily and roll accepted fixes into the explainer — contributors are recognized in the monthly $SQUID drop.
Loading notes…