
A crypto sell-off is a rapid, broad-based price decline driven by forced liquidations, macro fear, and capital rotation — distinct from a bear market, and increasingly shaped by ETF flows, corporate treasuries, and institutional positioning.
+12 sources across the wider coverage universe
 Crypto bulls suffered $563M in liquidations as macro fears triggered sharp sell-offs across bitcoin and ether, wiping out leveraged rally bets2026-05
 Crypto sell-off data suggests traders rotated capital within digital assets rather than exiting to cash, challenging claims that SpaceX IPO demand is draining Bitcoin liquidity2026-06
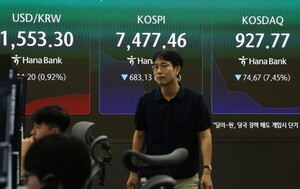 Korea's KOSPI plunged over 8% to 7,400 on June 8, 2026, triggering a Level 1 circuit breaker (20-minute trading halt) amid sharp sell-off driven by US semiconductor rout, Fed rate hike fears, and heavy foreign selling of 543.4 billion won.2026-06
 Strive CEO calls Thursday the 'most difficult day in digital credit history' as forced leverage liquidations drove STRC and SATA selloff2026-06
 Bitmine added 127,000 ether for $207 million, bringing its treasury to 5.54 million ETH (4.59% of circulating supply) and nearing its "Alchemy of 5%" target, while Chairman Tom Lee declared the crypto selloff "superficial" and argued ETH prices shouldn't be pressured despite the 30% drop from April highs.2026-06
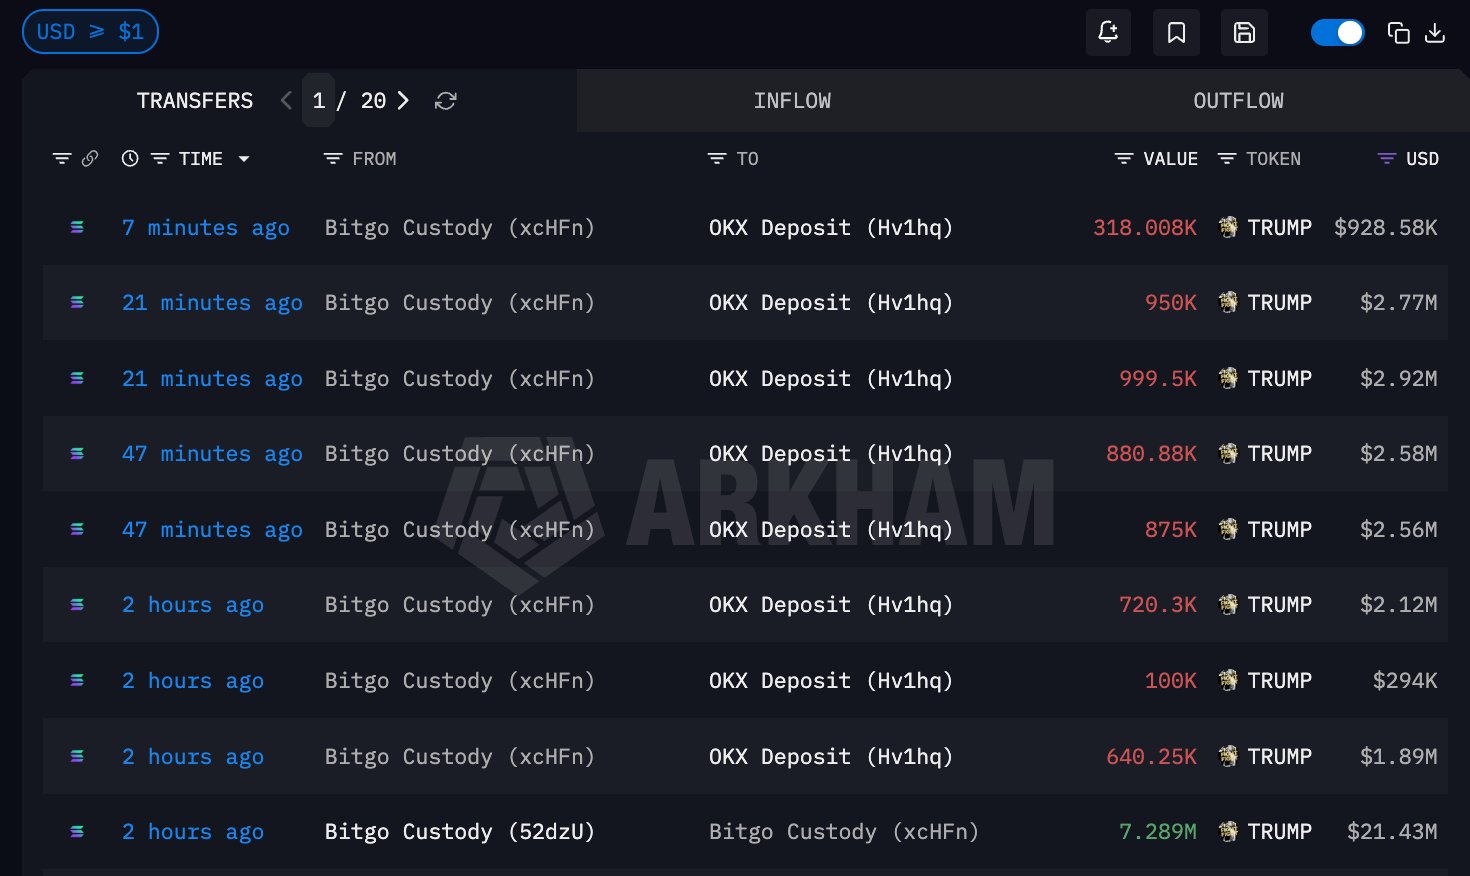 TRUMP team allocation wallets deposit 5.48M TRUMP to OKX in suspected $16M sell-off2026-03
A crypto sell-off is a sustained period of rapid, broad-based price declines across digital asset markets, typically driven by a combination of forced liquidations, macro fear, and shifts in capital allocation rather than fundamental deterioration in the underlying technology.
What Triggers a Crypto Sell-Off
No two sell-offs are identical, but most share a recognizable anatomy. The spark is usually external: a hawkish Federal Reserve statement, a geopolitical shock, a regulatory threat, or a major equity market dislocation. What turns a dip into a sell-off is the cascade that follows.
In June 2026, a confluence of factors put this pattern on full display. A rout in US semiconductor stocks — itself partly attributed by Fundstrat's Tom Lee to institutional funds repositioning ahead of the SpaceX IPO — rippled into crypto markets. Bitcoin fell to its lowest levels since February, briefly touching $59,000 and posting its worst weekly performance since 2022. South Korea's KOSPI plunged over 8% on June 8, triggering a Level 1 circuit breaker, as foreign selling accelerated on fears of Fed rate hikes and contagion from the US tech selloff. Global risk appetite collapsed simultaneously across asset classes.
The sequence matters: equity volatility rises → institutional portfolios rebalance → liquid assets (including Bitcoin and ETH) are sold to meet margin requirements or reduce overall risk exposure → prices fall → leveraged crypto positions face liquidation calls → more selling ensues. It is a self-reinforcing loop that can compress weeks of gains into hours.

Tech sell-off drags Wall Street and global markets lower as S&P 500 futures fall, Asia and Europe sink, and oil eases on U.S.-Iran progress.
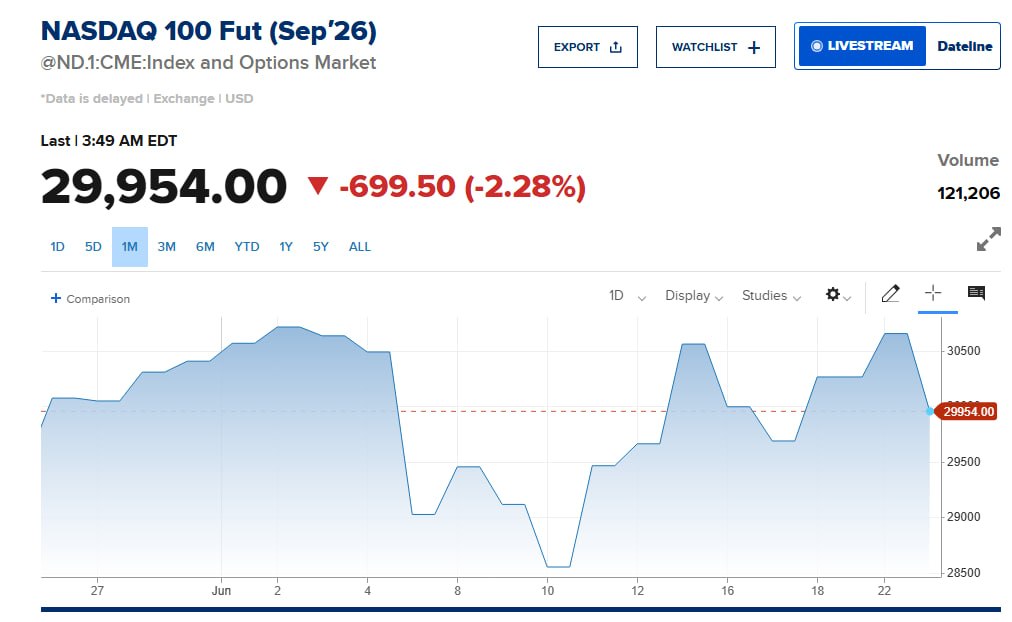

BTC off ~2% alongside Nasdaq futures while Brent sits near $76 puts crypto back in the high-duration bucket. Cheaper oil helps the CPI path, but if semis and AI names keep de-grossing, the pressure point is perp leverage and basis trades, especially the Ethena/Pendle yield stack that depends on calm funding. Watch whether BTC holds up against NDX, because that tells you if “digital gold” has any bid here or if it is just another crowded tech beta leg.
Readers don't click sell-off stories for price charts — they click when there is a named actor behind the selling (a bankrupt estate, a presidential token wallet, a hack victim funneling proceeds) because that actor's motive and timeline can be front-run, absorbed, or litigated, whereas diffuse macro selling cannot.
Leverage and Forced Liquidations
Leverage amplifies both gains and losses, and it is often the hidden accelerant in crypto sell-offs. When traders borrow to buy assets and prices fall, exchanges automatically liquidate those positions to protect lenders. These forced sales are indiscriminate — they hit regardless of the seller's conviction about long-term value.
The June 2026 episode illustrated this starkly in the digital credit space. Strive's CEO described the period as "the most difficult day in the history of digital credit," pointing to forced leverage liquidations as the primary driver of sharp declines in instruments like STRC and SATA. When leverage unwinds at scale, even assets with strong fundamentals can see price moves that look catastrophic in isolation but are mechanically explained by margin calls rather than any change in underlying value.
On-chain data captured the same dynamic in Bitcoin. At the trough of the June sell-off, roughly half of all BTC supply was trading at a loss — a metric watched closely by analysts as a sentiment indicator. Historically, broad underwater supply has coincided with capitulation phases, though it can also precede extended bearish periods.
Capital Rotation vs. Capitulation
One of the most important distinctions analysts make during a sell-off is whether money is leaving the crypto ecosystem entirely or simply moving between assets within it. The two scenarios have very different implications.
In June 2026, on-chain data suggested the former was not happening. Analysts including 0xMert argued publicly that the Bitcoin decline was "just capital rotation" — funds moving to other opportunities rather than a structural exit from digital assets. Crypto options activity in related stocks simultaneously showed high-conviction bullish bets, suggesting sophisticated traders were treating lower prices as entry opportunities rather than warnings of deeper trouble.
This reading was contested. $1.7 billion in Bitcoin ETF outflows over a short window — reported at the NYSE-based Public Keys briefing — pointed to at least some institutional de-risking. The debate between "rotation" and "capitulation" is rarely resolved in real time; it is usually only legible in hindsight when either prices recover or the sell-off deepens into a prolonged bear market.
What data consistently shows is that sell-offs which stay contained within crypto — where stablecoins absorb flows rather than seeing net exits to fiat — tend to resolve faster than those driven by macro-forced de-risking across all asset classes.
- 01Forced estate liquidations
The Celsius court-ordered altcoin-to-BTC/ETH conversion drew the most clicks because a specific date, a specific counterparty, and a specific asset rotation gave traders an actionable edge unavailable in generic sell-off coverage.
- 02Macro equity contagion
The S&P $2.4T single-day wipeout and Trump tariff shock headlines attracted outsized clicks because they established the external trigger that forced crypto correlation trades to unwind.
- 03Leveraged long cascade
Headlines quantifying liquidation totals ($1.6B, $563M) attracted sustained engagement because the magnitude of forced unwinds signals whether a sell-off is reflexive and self-amplifying or isolated.
- 04Whale and insider dump signals
The TRUMP team OKX deposit and Justin Sun's public contemplation of FTX token absorption drew clicks because identified large sellers telegraph both the sell-side volume and a potential bid that could cap downside.
- 05Dip-buy counter-narrative
ARK's $29M COIN/HOOD purchase and ETF inflow absorption stories attracted readers seeking a bull case during panic, functioning as a sentiment anchor rather than additional sell-off coverage.
- 06Alt-token structural fragility
The altcoin ETF backfire story — 130 pending SEC applications meeting a brutal sell-off — resonated because it reframed the crash as validation of pre-existing structural risk rather than random volatility.
How Bitcoin Behaves as Bellwether
Bitcoin's outsized weight in total crypto market capitalization means its price action sets the tone for everything else. When BTC falls sharply, altcoins almost universally fall further — a phenomenon sometimes called "beta amplification." In the June 2026 sell-off, ETH dropped roughly 30% from April highs, NEAR Protocol fell over 7% in a single session, and Algorand shed 7.44% as a post-quantum rally faded.
This correlation structure has important implications. Bitcoin is often the first asset institutional investors sell when they need liquidity, because it has the deepest markets and the tightest bid-ask spreads. That liquidity premium means BTC absorbs the initial shock; altcoins with thinner order books then gap lower as sentiment deteriorates.
Despite this dynamic, not all institutional players retreat. Morgan Stanley was reported to have quietly doubled down on Bitcoin exposure during the June sell-off — a reminder that large institutions with longer time horizons often view price dislocations as accumulation opportunities. Sovereign wealth vehicles take a similar approach: Bhutan, which has been publicly known to hold Bitcoin mined from its hydroelectric surplus, represents the kind of long-duration holder that rarely participates in sell-offs as a seller.
The Role of ETFs and Institutional Flows
The introduction of spot Bitcoin ETFs in the United States created a new flow mechanism that interacts with sell-offs in ways that are still being understood. ETF outflows during a sell-off represent genuine liquidation by retail and institutional holders who bought via regulated wrappers — they are real sellers, not leveraged positions being auto-closed.
The $1.7 billion in Bitcoin ETF outflows observed in early June 2026 was significant but not unprecedented. For context, the ETF complex had seen larger single-day inflow spikes during earlier bull phases. The key question analysts track is whether outflows cluster at the start of a sell-off (suggesting panic) or arrive gradually over days (suggesting systematic rebalancing). Gradual outflows tend to stabilize faster.
Coinbase, as the primary custodian for most US spot Bitcoin ETFs, occupies a structurally important position during these periods. Its institutional desk activity, while not publicly disclosed in real time, provides a backstop of liquidity that retail-only exchanges cannot match. Sell-offs that see Coinbase premium (the price of BTC on Coinbase relative to offshore exchanges) go negative are often interpreted as US institutional selling outpacing demand — a bearish signal.
- 2025-02exploit
Bybit hack proceeds fuel Solana memecoin sell-off cascade
- 2025-02milestone
$563M leveraged long liquidations wipe out crypto rally bets
- 2025-04regulatory
Trump tariff shock triggers biggest crypto/equity sell-off since 2020
- 2025-04regulatory
Altcoin ETF rush collapses as sell-off erases billions; 130 SEC applications pending
- 2025-04milestone
AI competition fears spark Nasdaq -500pt rout, dragging crypto lower
- 2025-07governance
Celsius court-approved altcoin-to-BTC/ETH liquidation begins
- 2025-10milestone
ETH breaks below $3,000, hitting lowest level since October 2023
- 2026-06milestone
South Korea KOSPI plunges 8%, circuit breaker triggered amid global sell-off
Corporate Treasury Buyers During Sell-Offs
A relatively new feature of post-2020 crypto markets is the presence of corporate treasury buyers — companies that hold Bitcoin or ETH on their balance sheets and may add to positions during price declines. This dynamic can act as a partial demand buffer.
The June 2026 sell-off produced a notable example in ETH. Bitmine added 127,000 ETH for approximately $207 million during the downturn, bringing its total treasury to 5.54 million ETH — representing 4.59% of circulating supply. Chairman Tom Lee characterized the crypto sell-off as "superficial" and argued ETH prices were being pressured by macro sentiment rather than any deterioration in Ethereum's fundamentals.
Whether corporate treasury buying is sufficient to arrest sell-offs depends on scale. These buyers are typically slow-moving and publicly accountable, which means they can only deploy capital within board-approved parameters. They are a source of demand, not a floor.
Reading On-Chain Data During a Sell-Off
Blockchain's transparency creates a rich real-time dataset that equity markets lack. During sell-offs, analysts track several signals:
Realized loss vs. unrealized loss: When long-term holders (typically defined as wallets that haven't moved coins in over 155 days) begin selling at a loss, it signals a more serious capitulation than short-term holders liquidating. In June 2026, the data suggested primarily short-term holders were selling — a historically less bearish configuration.
Exchange inflows: A spike in BTC or ETH flowing onto exchanges suggests holders are preparing to sell. Sustained high inflows during a sell-off indicate more supply coming to market; declining inflows mid-sell-off can signal the peak of selling pressure.
Stablecoin dominance: When traders exit volatile assets but stay in crypto via USDC, USDT, or similar instruments, stablecoin market cap rises relative to total crypto market cap. This "dry powder" is available to re-enter the market quickly, which is why rotation-driven sell-offs tend to recover faster than macro-driven ones.
Circle, as the issuer of USDC, publishes reserve attestations that allow analysts to track whether stablecoin supply is expanding (suggesting capital staying in crypto) or contracting (suggesting exits to fiat). During the mid-2026 sell-off period, USDC supply remained stable, consistent with the capital-rotation interpretation.
- LiquidityHigh
Multiple sell-off episodes produced cascading liquidations exceeding $1.6B in a single event, with open interest collapsing simultaneously, removing the bid depth needed to arrest drawdowns.
- MarketHigh
Crypto sell-offs repeatedly correlated with equity dislocations — Trump tariff shock, Nasdaq AI-fear rout, and KOSPI circuit-breaker — confirming that macro risk-off now transmits to digital assets within hours.
- CentralizationHigh
Single large sellers (a bankruptcy estate, a presidential meme-coin treasury, a hacker routing stolen funds) have demonstrated the ability to set the intraday price direction for the entire crypto market.
- RegulatoryMedium
The altcoin ETF frenzy backfire exposed that SEC approval pipelines for volatile tokens can concentrate retail exposure in instruments that amplify sell-offs rather than smooth them.
- Smart-contractMedium
The Bybit hack proceeds being funneled into Solana memecoin infrastructure during a sell-off illustrates that protocol-layer exploits now add a directional selling vector on top of existing market stress.
- Information / rumorMedium
A false Mt. Gox alert from Arkham triggered a significant sell-off before correction, demonstrating that on-chain data platforms with large subscriber bases now constitute a systemic rumor-propagation risk.
Macro Context and Inflation Hedging Debates
Crypto sell-offs that coincide with broader risk-off moves reignite a recurring debate: is Bitcoin an inflation hedge, a risk asset, or something else entirely? The honest answer is that its behavior shifts depending on the dominant investor base and the nature of the macro shock.
In 2020-2021, Bitcoin showed some decorrelation from equities as institutional adoption was still nascent. By 2024-2026, with ETFs embedding BTC into traditional portfolios and corporate treasuries holding it alongside equities, the correlation to tech stocks during stress events tightened considerably. The June 2026 sell-off — where a semiconductor rout and rate hike fears hit Bitcoin and KOSPI simultaneously — is consistent with BTC being treated as a risk asset in the short term, regardless of its long-term store-of-value narrative.
This dual identity creates selling pressure in macro downturns that is structurally different from crypto-native sell-offs. When the Fed signals hawkishness, risk-parity funds that include Bitcoin must reduce exposure across all high-beta assets. That mechanical selling is not a commentary on Bitcoin's technology or adoption trajectory.
Sell-Off vs. Bear Market: The Distinction
Not every sell-off becomes a bear market. The term "sell-off" refers to a sharp, often short-duration decline — typically measured in days to weeks. A bear market implies sustained downward pressure over months, accompanied by declining on-chain activity, developer exits, and structural capitulation of long-term holders.
The distinguishing markers: bear markets tend to see declining stablecoin dominance (people exiting crypto entirely), shrinking Bitcoin network activity, reduced developer commits in major repositories, and persistent negative ETF flow trends. Sell-offs typically show the opposite — elevated trading volumes, stable or rising stablecoin balances, and options markets pricing in recovery rather than further decline.
Outlook
Sell-offs are a permanent feature of crypto markets, not an anomaly. The asset class's 24/7 trading, global retail participation, leverage accessibility, and sensitivity to both macro signals and crypto-native catalysts mean that sharp drawdowns will recur regardless of underlying adoption trends.
What has changed structurally since earlier cycles is the presence of institutional counterweights — ETF buyers, corporate treasuries, sovereign holders like Bhutan — that can absorb some selling pressure. Whether those counterweights are sufficient to compress the severity and duration of future sell-offs remains an open empirical question. The June 2026 episode, where Bitcoin recovered relatively quickly after touching multi-month lows, suggests the market's absorption capacity has grown. It does not guarantee that the next sell-off will be equally brief.
Latest Sell-Off news
Community notes
Spot something off or out of date? Drop a note. Editors review topic notes daily and roll accepted fixes into the explainer — contributors are recognized in the monthly $SQUID drop.
Loading notes…